1. Overview
1.概述
Clustering is an umbrella term for a class of unsupervised algorithms to discover groups of things, people, or ideas that are closely related to each other.
聚类是一类无监督算法的总称,用于发现彼此密切相关的事物、人或想法的群体。
In this apparently simple one-liner definition, we saw a few buzzwords. What exactly is clustering? What is an unsupervised algorithm?
在这个看似简单的单行本定义中,我们看到了一些流行语。到底什么是聚类?什么是无监督的算法?
In this tutorial, we’re going to, first, shed some lights on these concepts. Then, we’ll see how they can manifest themselves in Java.
在本教程中,我们将首先对这些概念进行一些说明。然后,我们将看到它们如何在Java中表现出来。
2. Unsupervised Algorithms
2.无监督的算法
Before we use most learning algorithms, we should somehow feed some sample data to them and allow the algorithm to learn from those data. In Machine Learning terminology, we call that sample dataset training data. Also, the whole process is known as the training process.
在我们使用大多数学习算法之前,我们应该以某种方式向它们提供一些样本数据,让算法从这些数据中学习。在机器学习的术语中,我们称该样本数据集为训练数据。此外,整个过程被称为训练过程。
Anyway, we can classify learning algorithms based on the amount of supervision they need during the training process. The two main types of learning algorithms in this category are:
总之,我们可以根据它们在训练过程中需要的监督量来对学习算法进行分类。这一类的学习算法主要有两种类型。
- Supervised Learning: In supervised algorithms, the training data should include the actual solution for each point. For example, if we’re about to train our spam filtering algorithm, we feed both the sample emails and their label, i.e. spam or not-spam, to the algorithm. Mathematically speaking, we’re going to infer the f(x) from a training set including both xs and ys.
- Unsupervised Learning: When there are no labels in training data, then the algorithm is an unsupervised one. For example, we have plenty of data about musicians and we’re going discover groups of similar musicians in the data.
3. Clustering
3.聚类
Clustering is an unsupervised algorithm to discover groups of similar things, ideas, or people. Unlike supervised algorithms, we’re not training clustering algorithms with examples of known labels. Instead, clustering tries to find structures within a training set where no point of the data is the label.
聚类是一种无监督的算法,用于发现类似事物、想法或人的群体。与有监督的算法不同,我们不是用已知标签的例子来训练聚类算法。相反,聚类试图在一个训练集中找到结构,其中数据中没有任何一点是标签。
3.1. K-Means Clustering
3.1.K-Means聚类法
K-Means is a clustering algorithm with one fundamental property: the number of clusters is defined in advance. In addition to K-Means, there are other types of clustering algorithms like Hierarchical Clustering, Affinity Propagation, or Spectral Clustering.
K-Means是一种具有一个基本属性的聚类算法。聚类的数量是预先定义的。除了K-Means之外,还有其他类型的聚类算法,如层次聚类、亲和传播或光谱聚类。
3.2. How K-Means Works
3.2.K-Means如何工作
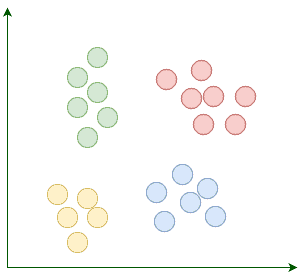
Suppose our goal is to find a few similar groups in a dataset like:
假设我们的目标是在一个数据集中找到几个相似的组,比如。
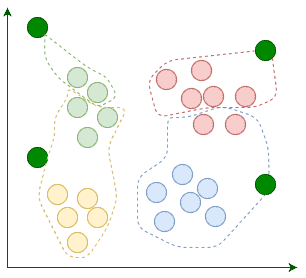
K-Means begins with k randomly placed centroids. Centroids, as their name suggests, are the center points of the clusters. For example, here we’re adding four random centroids:
K-Means以随机放置的k个中心点开始。中心点,顾名思义,是集群的中心点。例如,在这里我们要添加四个随机中心点。
Then we assign each existing data point to its nearest centroid:
然后,我们将每个现有的数据点分配给其最近的中心点。
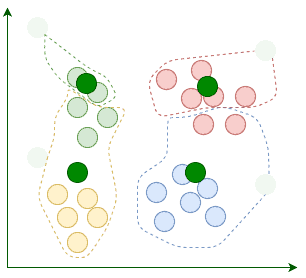
After the assignment, we move the centroids to the average location of points assigned to it. Remember, centroids are supposed to be the center points of clusters:
在分配之后,我们将中心点移动到分配给它的点的平均位置。记住,中心点应该是集群的中心点。
The current iteration concludes each time we’re done relocating the centroids. We repeat these iterations until the assignment between multiple consecutive iterations stops changing:
每次我们完成中心点的重新定位后,当前的迭代就会结束。我们重复这些迭代,直到多个连续迭代之间的分配停止变化:。
When the algorithm terminates, those four clusters are found as expected. Now that we know how K-Means works, let’s implement it in Java.
当算法终止时,这四个聚类就会如期找到。现在我们知道了K-Means的工作原理,让我们用Java来实现它。
3.3. Feature Representation
3.3.特征表示
When modeling different training datasets, we need a data structure to represent model attributes and their corresponding values. For example, a musician can have a genre attribute with a value like Rock. We usually use the term feature to refer to the combination of an attribute and its value.
在对不同的训练数据集进行建模时,我们需要一个数据结构来表示模型属性及其相应的值。例如,一个音乐家可以有一个流派属性,其值为摇滚。我们通常使用术语特征来指代属性和其值的组合。
To prepare a dataset for a particular learning algorithm, we usually use a common set of numerical attributes that can be used to compare different items. For example, if we let our users tag each artist with a genre, then at the end of the day, we can count how many times each artist is tagged with a specific genre:
为了给特定的学习算法准备一个数据集,我们通常使用一组共同的数字属性,可以用来比较不同的项目。例如,如果我们让用户给每个艺术家贴上流派的标签,那么在最后,我们可以计算每个艺术家被贴上特定流派的次数。
The feature vector for an artist like Linkin Park is [rock -> 7890, nu-metal -> 700, alternative -> 520, pop -> 3]. So if we could find a way to represent attributes as numerical values, then we can simply compare two different items, e.g. artists, by comparing their corresponding vector entries.
像Linkin Park这样的艺术家的特征向量是[rock -> 7890, nu-metal -> 700, alternative -> 520, pop -> 3]。因此,如果我们能够找到一种将属性表示为数值的方法,那么我们就可以简单地通过比较两个不同的项目,例如艺术家,来比较他们相应的向量条目。
Since numeric vectors are such versatile data structures, we’re going to represent features using them. Here’s how we implement feature vectors in Java:
由于数字向量是如此通用的数据结构,我们将使用它们来表示特征。下面是我们如何在Java中实现特征向量。
public class Record {
    private final String description;
    private final Map<String, Double> features;

    // constructor, getter, toString, equals and hashcode
}
3.4. Finding Similar Items
3.4.寻找类似项目
In each iteration of K-Means, we need a way to find the nearest centroid to each item in the dataset. One of the simplest ways to calculate the distance between two feature vectors is to use Euclidean Distance. The Euclidean distance between two vectors like [p1, q1] and [p2, q2] is equal to:
在K-Means的每次迭代中,我们需要一种方法来找到数据集中每个项目的最近中心点。计算两个特征向量之间距离的最简单方法之一是使用欧氏距离。像[p1, q1]和[p2, q2]这两个向量之间的欧氏距离等于。
Let’s implement this function in Java. First, the abstraction:
让我们用Java来实现这个函数。首先是抽象。
public interface Distance {
    double calculate(Map<String, Double> f1, Map<String, Double> f2);
}
In addition to Euclidean distance, there are other approaches to compute the distance or similarity between different items like the Pearson Correlation Coefficient. This abstraction makes it easy to switch between different distance metrics.
除了欧氏距离之外,还有其他方法来计算不同项目之间的距离或相似性,比如皮尔逊相关系数。这种抽象使得在不同的距离度量之间的切换变得容易。
Let’s see the implementation for Euclidean distance:
让我们看看欧氏距离的实现。
public class EuclideanDistance implements Distance {

    @Override
    public double calculate(Map<String, Double> f1, Map<String, Double> f2) {
        double sum = 0;
        for (String key : f1.keySet()) {
            Double v1 = f1.get(key);
            Double v2 = f2.get(key);

            if (v1 != null && v2 != null) {
                sum += Math.pow(v1 - v2, 2);
            }
        }

        return Math.sqrt(sum);
    }
}
First, we calculate the sum of squared differences between corresponding entries. Then, by applying the sqrt function, we compute the actual Euclidean distance.
首先,我们计算相应条目之间的平方差之和。然后,通过应用sqrt函数,我们计算出实际的欧氏距离。
3.5. Centroid Representation
3.5.中心点表示法
Centroids are in the same space as normal features, so we can represent them similar to features:
中心点与普通特征处于同一空间,所以我们可以用类似于特征的方式来表示它们。
public class Centroid {

    private final Map<String, Double> coordinates;

    // constructors, getter, toString, equals and hashcode
}
Now that we have a few necessary abstractions in place, it’s time to write our K-Means implementation. Here’s a quick look at our method signature:
现在我们已经有了一些必要的抽象,是时候编写我们的K-Means实现了。下面是对我们的方法签名的快速浏览。
public class KMeans {

    private static final Random random = new Random();

    public static Map<Centroid, List<Record>> fit(List<Record> records,
      int k,
      Distance distance,
      int maxIterations) {
        // omitted
    }
}
Let’s break down this method signature:
让我们来分析一下这个方法签名。
- The dataset is a set of feature vectors. Since each feature vector is a Record, then the dataset type is List<Record>
- The k parameter determines the number of clusters, which we should provide in advance
- distance encapsulates the way we’re going to calculate the difference between two features
- K-Means terminates when the assignment stops changing for a few consecutive iterations. In addition to this termination condition, we can place an upper bound for the number of iterations, too. The maxIterations argument determines that upper bound
- When K-Means terminates, each centroid should have a few assigned features, hence we’re using a Map<Centroid, List<Record>> as the return type. Basically, each map entry corresponds to a cluster
3.6. Centroid Generation
3.6.中心点生成
The first step is to generate k randomly placed centroids.
第一步是生成k 随机放置的中心点。
Although each centroid can contain totally random coordinates, it’s a good practice to generate random coordinates between the minimum and maximum possible values for each attribute. Generating random centroids without considering the range of possible values would cause the algorithm to converge more slowly.
尽管每个中心点可以包含完全随机的坐标,但在每个属性的最小和最大可能值之间生成随机坐标是一个好的做法。不考虑可能的值的范围而生成随机中心点会导致算法收敛得更慢。
First, we should compute the minimum and maximum value for each attribute, and then, generate the random values between each pair of them:
首先,我们应该计算每个属性的最小值和最大值,然后,在它们的每一对之间生成随机值。
private static List<Centroid> randomCentroids(List<Record> records, int k) {
    List<Centroid> centroids = new ArrayList<>();
    Map<String, Double> maxs = new HashMap<>();
    Map<String, Double> mins = new HashMap<>();

    for (Record record : records) {
        record.getFeatures().forEach((key, value) -> {
            // compares the value with the current max and choose the bigger value between them
            maxs.compute(key, (k1, max) -> max == null || value > max ? value : max);

            // compare the value with the current min and choose the smaller value between them
            mins.compute(key, (k1, min) -> min == null || value < min ? value : min);
        });
    }

    Set<String> attributes = records.stream()
      .flatMap(e -> e.getFeatures().keySet().stream())
      .collect(toSet());
    for (int i = 0; i < k; i++) {
        Map<String, Double> coordinates = new HashMap<>();
        for (String attribute : attributes) {
            double max = maxs.get(attribute);
            double min = mins.get(attribute);
            coordinates.put(attribute, random.nextDouble() * (max - min) + min);
        }

        centroids.add(new Centroid(coordinates));
    }

    return centroids;
}
Now, we can assign each record to one of these random centroids.
现在,我们可以把每条记录分配给这些随机中心点中的一个。
3.7. Assignment
3.7.赋值
First off, given a Record, we should find the centroid nearest to it:
首先,给定一个Record,我们应该找到离它最近的中心点。
private static Centroid nearestCentroid(Record record, List<Centroid> centroids, Distance distance) {
    double minimumDistance = Double.MAX_VALUE;
    Centroid nearest = null;

    for (Centroid centroid : centroids) {
        double currentDistance = distance.calculate(record.getFeatures(), centroid.getCoordinates());

        if (currentDistance < minimumDistance) {
            minimumDistance = currentDistance;
            nearest = centroid;
        }
    }

    return nearest;
}
Each record belongs to its nearest centroid cluster:
每条记录都属于其最近的中心点集群。
private static void assignToCluster(Map<Centroid, List<Record>> clusters,
  Record record,
  Centroid centroid) {
    clusters.compute(centroid, (key, list) -> {
        if (list == null) {
            list = new ArrayList<>();
        }

        list.add(record);
        return list;
    });
}
3.8. Centroid Relocation
3.8.中心点重新定位
If, after one iteration, a centroid does not contain any assignments, then we won’t relocate it. Otherwise, we should relocate the centroid coordinate for each attribute to the average location of all assigned records:
如果在一次迭代之后,一个中心点不包含任何赋值,那么我们就不会重新定位它。否则,我们应该将每个属性的中心点坐标重新定位到所有分配记录的平均位置。
private static Centroid average(Centroid centroid, List<Record> records) {
    if (records == null || records.isEmpty()) {
        return centroid;
    }

    Map<String, Double> average = centroid.getCoordinates();
    records.stream().flatMap(e -> e.getFeatures().keySet().stream())
      .forEach(k -> average.put(k, 0.0));

    for (Record record : records) {
        record.getFeatures().forEach(
          (k, v) -> average.compute(k, (k1, currentValue) -> v + currentValue)
        );
    }

    average.forEach((k, v) -> average.put(k, v / records.size()));

    return new Centroid(average);
}
Since we can relocate a single centroid, now it’s possible to implement the relocateCentroids method:
既然我们可以重新定位一个中心点,现在就可以实现relocateCentroids方法。
private static List<Centroid> relocateCentroids(Map<Centroid, List<Record>> clusters) {
    return clusters.entrySet().stream().map(e -> average(e.getKey(), e.getValue())).collect(toList());
}
This simple one-liner iterates through all centroids, relocates them, and returns the new centroids.
这个简单的单行程序迭代了所有的中心点,重新定位它们,并返回新的中心点。
3.9. Putting It All Together
3.9.归纳总结
In each iteration, after assigning all records to their nearest centroid, first, we should compare the current assignments with the last iteration.
在每次迭代中,在将所有记录分配给其最近的中心点后,首先,我们应该将当前的分配与上一次迭代进行比较。
If the assignments were identical, then the algorithm terminates. Otherwise, before jumping to the next iteration, we should relocate the centroids:
如果分配是相同的,那么算法就终止了。否则,在跳转到下一次迭代之前,我们应该重新定位中心点。
public static Map<Centroid, List<Record>> fit(List<Record> records,
  int k,
  Distance distance,
  int maxIterations) {

    List<Centroid> centroids = randomCentroids(records, k);
    Map<Centroid, List<Record>> clusters = new HashMap<>();
    Map<Centroid, List<Record>> lastState = new HashMap<>();

    // iterate for a pre-defined number of times
    for (int i = 0; i < maxIterations; i++) {
        boolean isLastIteration = i == maxIterations - 1;

        // in each iteration we should find the nearest centroid for each record
        for (Record record : records) {
            Centroid centroid = nearestCentroid(record, centroids, distance);
            assignToCluster(clusters, record, centroid);
        }

        // if the assignments do not change, then the algorithm terminates
        boolean shouldTerminate = isLastIteration || clusters.equals(lastState);
        lastState = clusters;
        if (shouldTerminate) {
            break;
        }

        // at the end of each iteration we should relocate the centroids
        centroids = relocateCentroids(clusters);
        clusters = new HashMap<>();
    }

    return lastState;
}
4. Example: Discovering Similar Artists on Last.fm
4.例子 在Last.fm上发现相似的艺术家
Last.fm builds a detailed profile of each user’s musical taste by recording details of what the user listens to. In this section, we’re going to find clusters of similar artists. To build a dataset appropriate for this task, we’ll use three APIs from Last.fm:
Last.fm通过记录用户听什么的细节,建立了每个用户的音乐品味的详细档案。在本节中,我们要找到相似艺术家的集群。为了建立一个适合这项任务的数据集,我们将使用Last.fm的三个API。
- API to get a collection of top artists on Last.fm.
- Another API to find popular tags. Each user can tag an artist with something, e.g. rock. So, Last.fm maintains a database of those tags and their frequencies.
- And an API to get the top tags for an artist, ordered by popularity. Since there are many such tags, we’ll only keep those tags that are among the top global tags.
4.1. Last.fm’s API
4.1.Last.fm的API
To use these APIs, we should get an API Key from Last.fm and send it in every HTTP request. We’re going to use the following Retrofit service for calling those APIs:
要使用这些API,我们应该从Last.fm获得一个API密钥,并在每次HTTP请求中发送该密钥。我们将使用以下Retrofit服务来调用这些API。
public interface LastFmService {

    @GET("/2.0/?method=chart.gettopartists&format=json&limit=50")
    Call<Artists> topArtists(@Query("page") int page);

    @GET("/2.0/?method=artist.gettoptags&format=json&limit=20&autocorrect=1")
    Call<Tags> topTagsFor(@Query("artist") String artist);

    @GET("/2.0/?method=chart.gettoptags&format=json&limit=100")
    Call<TopTags> topTags();

    // A few DTOs and one interceptor
}
So, let’s find the most popular artists on Last.fm:
因此,让我们在Last.fm上找到最受欢迎的艺术家。
// setting up the Retrofit service

private static List<String> getTop100Artists() throws IOException {
    List<String> artists = new ArrayList<>();
    // Fetching the first two pages, each containing 50 records.
    for (int i = 1; i <= 2; i++) {
        artists.addAll(lastFm.topArtists(i).execute().body().all());
    }

    return artists;
}
Similarly, we can fetch the top tags:
同样地,我们可以获取顶级标签。
private static Set<String> getTop100Tags() throws IOException {
    return lastFm.topTags().execute().body().all();
}
Finally, we can build a dataset of artists along with their tag frequencies:
最后,我们可以建立一个艺术家的数据集,以及他们的标签频率。
private static List<Record> datasetWithTaggedArtists(List<String> artists,
  Set<String> topTags) throws IOException {
    List<Record> records = new ArrayList<>();
    for (String artist : artists) {
        Map<String, Double> tags = lastFm.topTagsFor(artist).execute().body().all();

        // Only keep popular tags.
        tags.entrySet().removeIf(e -> !topTags.contains(e.getKey()));

        records.add(new Record(artist, tags));
    }

    return records;
}
4.2. Forming Artist Clusters
4.2.形成艺术家集群
Now, we can feed the prepared dataset to our K-Means implementation:
现在,我们可以将准备好的数据集送入我们的K-Means实现。
List<String> artists = getTop100Artists();
Set<String> topTags = getTop100Tags();
List<Record> records = datasetWithTaggedArtists(artists, topTags);

Map<Centroid, List<Record>> clusters = KMeans.fit(records, 7, new EuclideanDistance(), 1000);
// Printing the cluster configuration
clusters.forEach((key, value) -> {
    System.out.println("-------------------------- CLUSTER ----------------------------");

    // Sorting the coordinates to see the most significant tags first.
    System.out.println(sortedCentroid(key));
    String members = String.join(", ", value.stream().map(Record::getDescription).collect(toSet()));
    System.out.print(members);

    System.out.println();
    System.out.println();
});
If we run this code, then it would visualize the clusters as text output:
如果我们运行这段代码,那么它将把集群可视化为文本输出。
------------------------------ CLUSTER -----------------------------------
Centroid {classic rock=65.58333333333333, rock=64.41666666666667, british=20.333333333333332, ... }
David Bowie, Led Zeppelin, Pink Floyd, System of a Down, Queen, blink-182, The Rolling Stones, Metallica,
Fleetwood Mac, The Beatles, Elton John, The Clash

------------------------------ CLUSTER -----------------------------------
Centroid {Hip-Hop=97.21428571428571, rap=64.85714285714286, hip hop=29.285714285714285, ... }
Kanye West, Post Malone, Childish Gambino, Lil Nas X, A$AP Rocky, Lizzo, xxxtentacion,
Travi$ Scott, Tyler, the Creator, Eminem, Frank Ocean, Kendrick Lamar, Nicki Minaj, Drake

------------------------------ CLUSTER -----------------------------------
Centroid {indie rock=54.0, rock=52.0, Psychedelic Rock=51.0, psychedelic=47.0, ... }
Tame Impala, The Black Keys

------------------------------ CLUSTER -----------------------------------
Centroid {pop=81.96428571428571, female vocalists=41.285714285714285, indie=22.785714285714285, ... }
Ed Sheeran, Taylor Swift, Rihanna, Miley Cyrus, Billie Eilish, Lorde, Ellie Goulding, Bruno Mars,
Katy Perry, Khalid, Ariana Grande, Bon Iver, Dua Lipa, Beyoncé, Sia, P!nk, Sam Smith, Shawn Mendes,
Mark Ronson, Michael Jackson, Halsey, Lana Del Rey, Carly Rae Jepsen, Britney Spears, Madonna,
Adele, Lady Gaga, Jonas Brothers

------------------------------ CLUSTER -----------------------------------
Centroid {indie=95.23076923076923, alternative=70.61538461538461, indie rock=64.46153846153847, ... }
Twenty One Pilots, The Smiths, Florence + the Machine, Two Door Cinema Club, The 1975, Imagine Dragons,
The Killers, Vampire Weekend, Foster the People, The Strokes, Cage the Elephant, Arcade Fire,
Arctic Monkeys

------------------------------ CLUSTER -----------------------------------
Centroid {electronic=91.6923076923077, House=39.46153846153846, dance=38.0, ... }
Charli XCX, The Weeknd, Daft Punk, Calvin Harris, MGMT, Martin Garrix, Depeche Mode, The Chainsmokers,
Avicii, Kygo, Marshmello, David Guetta, Major Lazer

------------------------------ CLUSTER -----------------------------------
Centroid {rock=87.38888888888889, alternative=72.11111111111111, alternative rock=49.16666666, ... }
Weezer, The White Stripes, Nirvana, Foo Fighters, Maroon 5, Oasis, Panic! at the Disco, Gorillaz,
Green Day, The Cure, Fall Out Boy, OneRepublic, Paramore, Coldplay, Radiohead, Linkin Park,
Red Hot Chili Peppers, Muse
Since centroid coordinations are sorted by the average tag frequency, we can easily spot the dominant genre in each cluster. For example, the last cluster is a cluster of a good old rock-bands, or the second one is filled with rap stars.
由于中心点坐标是按平均标签频率排序的,我们可以很容易地发现每个集群中的主要流派。例如,最后一个集群是一个好的老摇滚乐队的集群,或者第二个集群充满了说唱明星。
Although this clustering makes sense, for the most part, it’s not perfect since the data is merely collected from user behavior.
尽管这种聚类是有意义的,但在大多数情况下,它并不完美,因为数据只是从用户行为中收集而来。
5. Visualization
5.视觉化
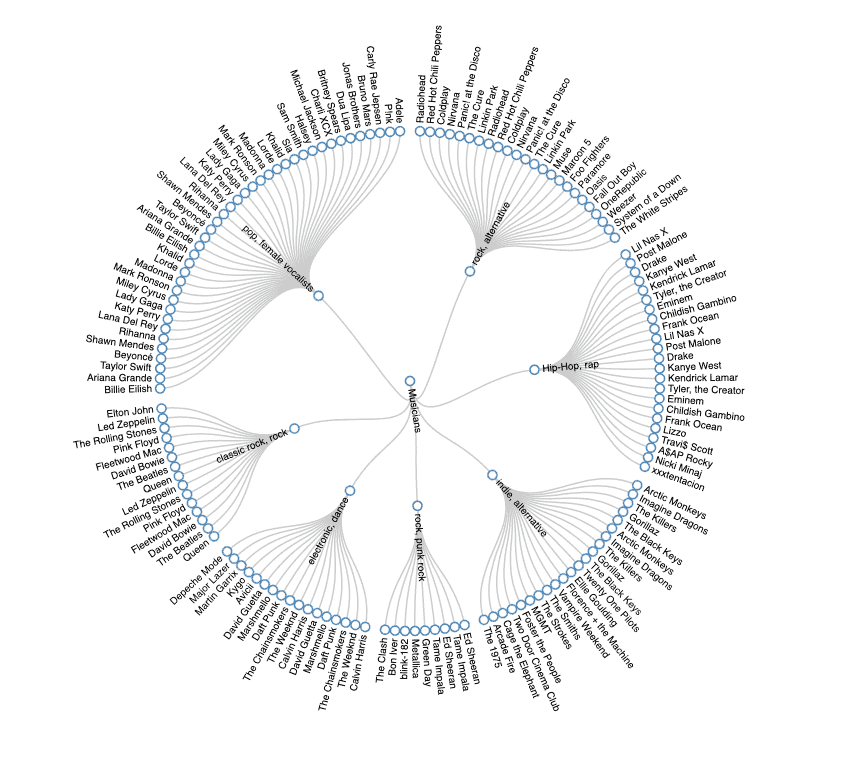
A few moments ago, our algorithm visualized the cluster of artists in a terminal-friendly way. If we convert our cluster configuration to JSON and feed it to D3.js, then with a few lines of JavaScript, we’ll have a nice human-friendly Radial Tidy-Tree:
刚才,我们的算法以一种终端友好的方式将艺术家集群可视化。如果我们将我们的集群配置转换为JSON,并将其送入D3.js,那么只需几行JavaScript,我们就会有一个漂亮的人类友好的radial Tidy-Tree。
We have to convert our Map<Centroid, List<Record>> to a JSON with a similar schema like this d3.js example.
我们必须将我们的Map<Centroid, List<Record>>转换为类似这个d3.js例子模式的JSON。
6. Number of Clusters
6.集群的数量
One of the fundamental properties of K-Means is the fact that we should define the number of clusters in advance. So far, we used a static value for k, but determining this value can be a challenging problem. There are two common ways to calculate the number of clusters:
K-Means的基本属性之一是我们应该事先定义集群的数量。到目前为止,我们使用了k的静态值,但是确定这个值可能是一个具有挑战性的问题。有两种常见的方法来计算聚类的数量:。
- Domain Knowledge
- Mathematical Heuristics
If we’re lucky enough that we know so much about the domain, then we might be able to simply guess the right number. Otherwise, we can apply a few heuristics like Elbow Method or Silhouette Method to get a sense on the number of clusters.
如果我们足够幸运,我们对这个领域有如此多的了解,那么我们也许能够简单地猜出正确的数字。否则,我们可以应用一些启发式的方法,如肘部法或剪影法来了解集群的数量。
Before going any further, we should know that these heuristics, although useful, are just heuristics and may not provide clear-cut answers.
在进一步讨论之前,我们应该知道,这些启发式方法虽然有用,但只是启发式方法,可能不会提供明确的答案。
6.1. Elbow Method
6.1.弯头法
To use the elbow method, we should first calculate the difference between each cluster centroid and all its members. As we group more unrelated members in a cluster, the distance between the centroid and its members goes up, hence the cluster quality decreases.
当我们把更多不相关的成员归入一个聚类时,中心点和其成员之间的距离就会增加,因此聚类质量会下降。
One way to perform this distance calculation is to use the Sum of Squared Errors. Sum of squared errors or SSE is equal to the sum of squared differences between a centroid and all its members:
进行这种距离计算的一种方法是使用平方误差之和。平方误差之和或SSE等于一个中心点与其所有成员之间的平方差之和。
public static double sse(Map<Centroid, List<Record>> clustered, Distance distance) {
    double sum = 0;
    for (Map.Entry<Centroid, List<Record>> entry : clustered.entrySet()) {
        Centroid centroid = entry.getKey();
        for (Record record : entry.getValue()) {
            double d = distance.calculate(centroid.getCoordinates(), record.getFeatures());
            sum += Math.pow(d, 2);
        }
    }

    return sum;
}
Then, we can run the K-Means algorithm for different values of k and calculate the SSE for each of them:
然后,我们可以对不同的k值运行K-Means算法,并计算出每个人的SSE。
List<Record> records = // the dataset;
Distance distance = new EuclideanDistance();
List<Double> sumOfSquaredErrors = new ArrayList<>();
for (int k = 2; k <= 16; k++) {
    Map<Centroid, List<Record>> clusters = KMeans.fit(records, k, distance, 1000);
    double sse = Errors.sse(clusters, distance);
    sumOfSquaredErrors.add(sse);
}
At the end of the day, it’s possible to find an appropriate k by plotting the number of clusters against the SSE:
最后,通过绘制集群数量与SSE的对比图,可以找到一个合适的k。
Usually, as the number of clusters increases, the distance between cluster members decreases. However, we can’t choose any arbitrary large values for k, since having multiple clusters with just one member defeats the whole purpose of clustering.
通常情况下,随着集群数量的增加,集群成员之间的距离也会减少。然而,我们不能为k选择任何任意的大值,因为只有一个成员的多个聚类违背了聚类的整个目的。
The idea behind the elbow method is to find an appropriate value for k in a way that the SSE decreases dramatically around that value. For example, k=9 can be a good candidate here.
肘部方法背后的想法是为k找到一个合适的值,使SSE在该值附近急剧下降。例如,k=9可以是这里的一个很好的候选者。
7. Conclusion
7.结语
In this tutorial, first, we covered a few important concepts in Machine Learning. Then we got aquatinted with the mechanics of the K-Means clustering algorithm. Finally, we wrote a simple implementation for K-Means, tested our algorithm with a real-world dataset from Last.fm, and visualized the clustering result in a nice graphical way.
在本教程中,首先,我们涵盖了机器学习中的一些重要概念。然后我们了解了K-Means聚类算法的机制。最后,我们为K-Means写了一个简单的实现,用Last.fm的一个真实世界的数据集测试了我们的算法,并以一种漂亮的图形方式可视化了聚类结果。
As usual, the sample code is available on our GitHub project, so make sure to check it out!
像往常一样,样本代码可在我们的GitHub项目中找到,因此请务必查看!


