1. Overview
1.概述
In this quick guide, we’ll see how to debug Java programs using the Eclipse IDE.
在这个快速指南中,我们将看到如何使用Eclipse IDE来调试Java程序。
2. Basic Concepts
2.基本概念
Eclipse has great support for debugging an application. It visualizes step-by-step execution and helps us uncover bugs.
Eclipse对调试应用程序有很大的支持。它可以将一步步的执行可视化,帮助我们发现错误。
To demonstrate the debugging features in Eclipse, we’ll use a sample program PerfectSquareCounter. This program counts the total perfect squares and even perfect squares under a given number:
为了演示 Eclipse 的调试功能,我们将使用一个示例程序 PerfectSquareCounter。这个程序计算一个给定数字下的总完美方格和偶数完美方格。
public class PerfectSquareCounter {

    static int evenPerfectSquareNumbers = 0;

    public static void main(String[] args) {
        int i = 100;
        System.out.println("Total Perfect Squares: " + calculateCount(i));
        System.out.println("Even Perfect Squares : " + evenPerfectSquareNumbers);
    }

    public static int calculateCount(int i) {
        int perfectSquaresCount = 0;
        for (int number = 1; number <= i; number++) {
            if (isPerfectSquare(number)) {
                perfectSquaresCount++;
                if (number % 2 == 0) {
                    evenPerfectSquareNumbers++;
                }
            }
        }
        return perfectSquaresCount;
    }

    private static boolean isPerfectSquare(int number) {
        double sqrt = Math.sqrt(number);
        return sqrt - Math.floor(sqrt) == 0;
    }
}
2.1. Debug Mode
2.1 调试模式
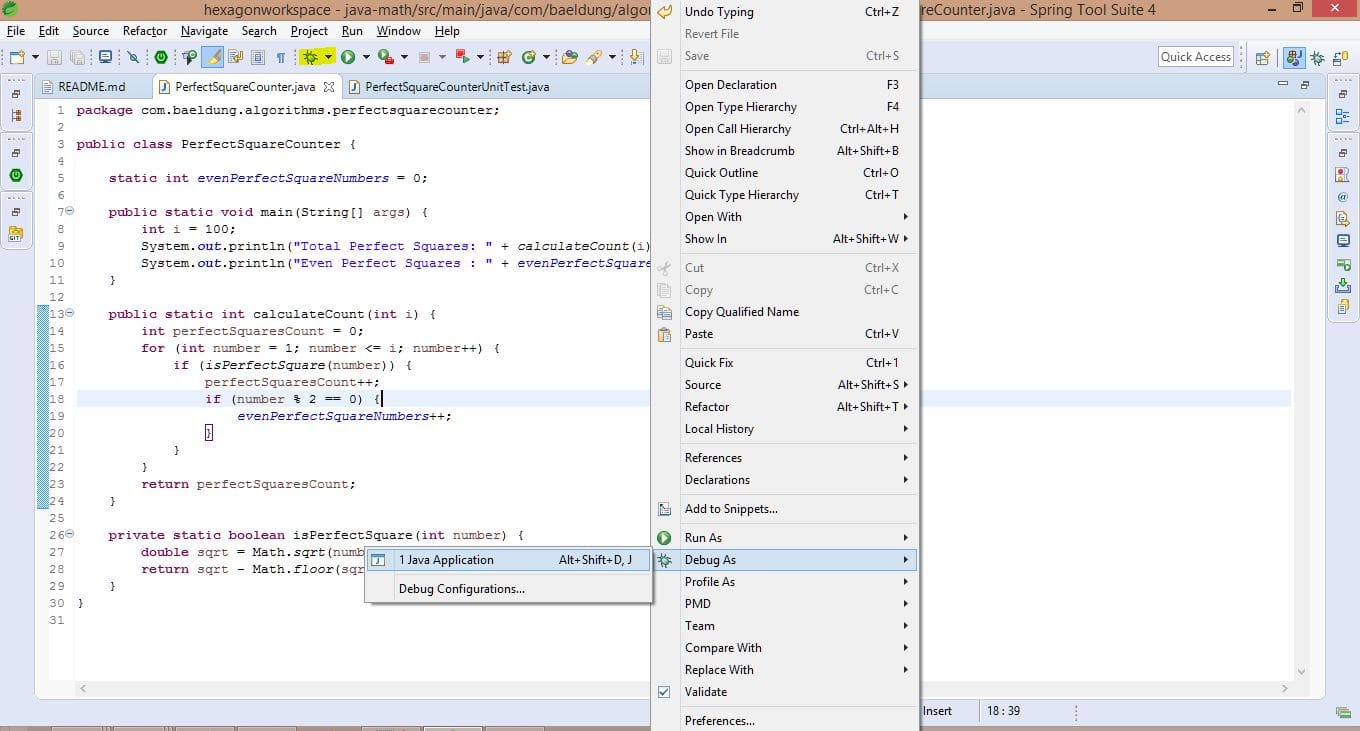
First, we need to start the Java program within Eclipse in debug mode. This can be achieved in two ways:
首先,我们需要在Eclipse中以调试模式启动Java程序。这可以通过两种方式实现。
- Right-click on the editor and select Debug As -> Java Application (shown in below screenshot)
- Debug the program from the toolbar (highlighted in below screenshot)
2.2. Breakpoints
2.2.断点
We need to define the points at which the program execution should pause for investigation. These are called breakpoints and are applicable for methods. They can also be defined anytime before or during execution.
我们需要定义程序执行应该暂停的点以进行调查。这些被称为断点,适用于方法。它们也可以在执行前或执行过程中随时定义。
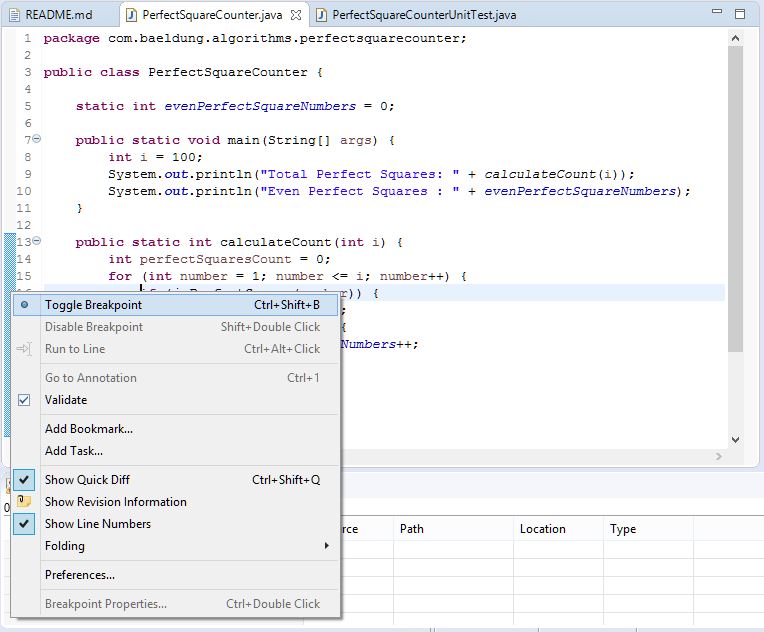
Basically, there are 3 ways to add breakpoints to the program:
基本上,有3种方法可以在程序中添加断点。
- Right-click on the marker bar (vertical ruler) corresponding to the line and select Toggle Breakpoint (shown in the below screenshot)
- Press Ctrl+Shift+B on the necessary line while in the editor
- Double-click on the marker bar (vertical ruler) corresponding to the necessary line
2.3. Code-Flow Controls
2.3.代码流控制
Now that the debugger stops at the given breakpoints, we can proceed with further execution.
现在,调试器在给定的断点处停止,我们可以继续进一步执行。
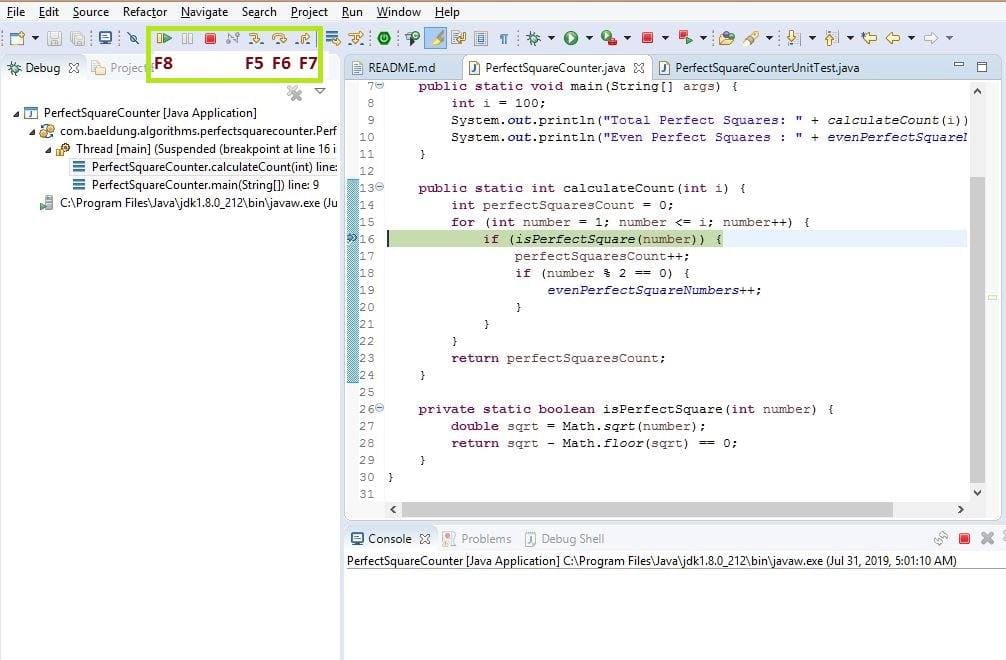
Let’s assume that the debugger is currently positioned as per the below screenshot, at Line 16:
让我们假设调试器目前的位置是下面的截图,在第16行。
The most commonly used debug options are:
最常用的调试选项是。
- Step Into (F5) – This operation goes inside the methods used in the current line (if any); else, it proceeds to the next line. In this example, it will take the debugger inside the method isPerfectSquare()
- Step Over (F6) – This operation processes the current line and proceeds to the next line. In this example, this will execute the method isPerfectSquare() and proceed to the next line
- Step Return (F7) – This operation finishes the current method and takes us back to the calling method. Since in this case, we have a breakpoint in the loop, it will be still within the method, else it would go back to the main method
- Resume (F8) – This operation will simply continue with the execution until the program ends unless we hit any further breakpoint
2.4. Debug Perspective
2.4.调试视角
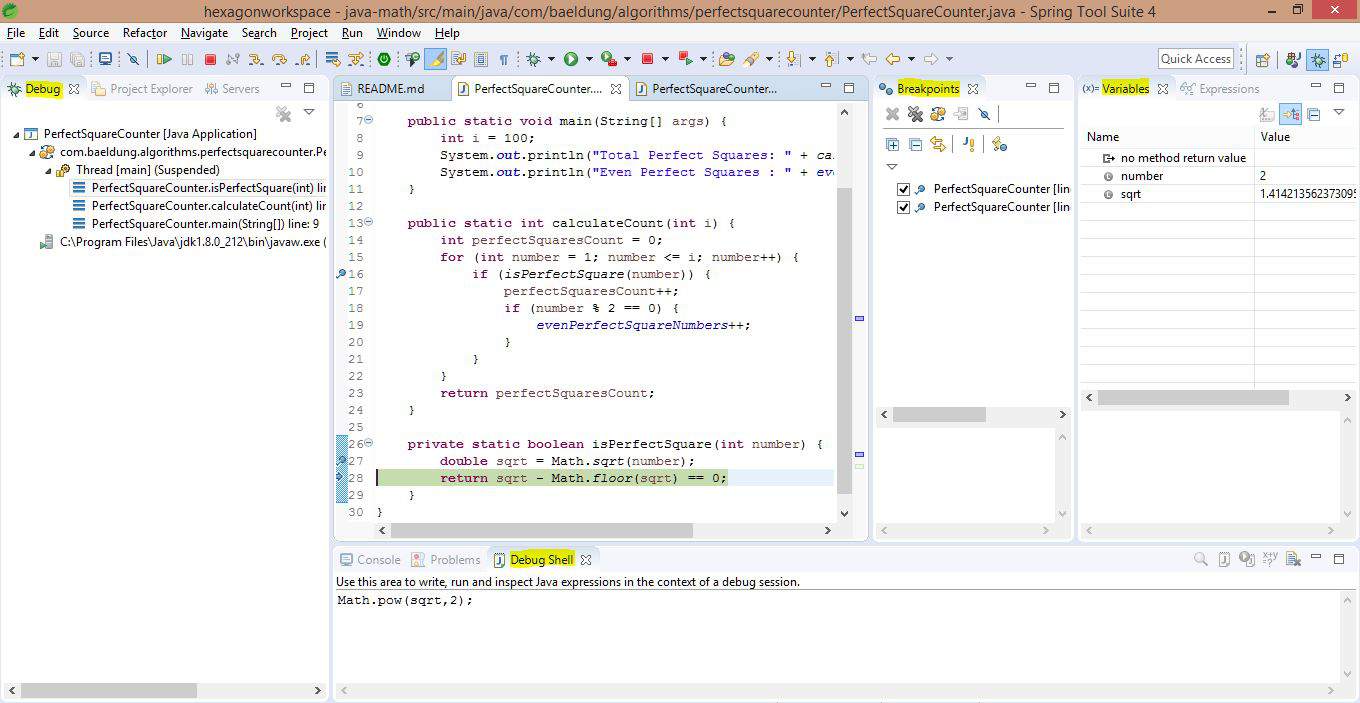
When we start the program in debug mode, Eclipse will prompt with an option to switch to the Debug perspective. The Debug perspective is a collection of some useful views that help us visualize and interact with the debugger.
当我们以调试模式启动程序时,Eclipse会提示有一个选项可以切换到调试视角。调试视角是一些有用的视图的集合,可以帮助我们可视化并与调试器进行交互。
We can also switch to the Debug perspective manually at any time.
我们也可以在任何时候手动切换到调试视角。
Here are some of the most useful views that this contains:
以下是其中包含的一些最有用的观点。
- Debug view – This shows the different threads and call stack traces
- Variables view – This shows the values of the variables at any given point. If we need to see the static variables, we need to explicitly specify that
- Breakpoints – This shows the different breakpoints and watchpoints (which we will see below)
- Debug Shell – This allows us to write and evaluate custom code while debugging (an example is covered later)
3. Techniques
3.技术
In this section, we’ll go through some important techniques that will help us to master debugging in Eclipse.
在本节中,我们将了解一些重要的技术,这些技术将帮助我们掌握Eclipse中的调试。
3.1. Variables
3.1. 变量
We can see the values of variables during the execution under the Variables view. In order to see the static variables, we can select the drop-down option Java -> Show Static Variables.
我们可以在Variables视图下看到执行过程中的变量值。为了看到静态变量,我们可以选择下拉选项Java -> Show Static Variables。
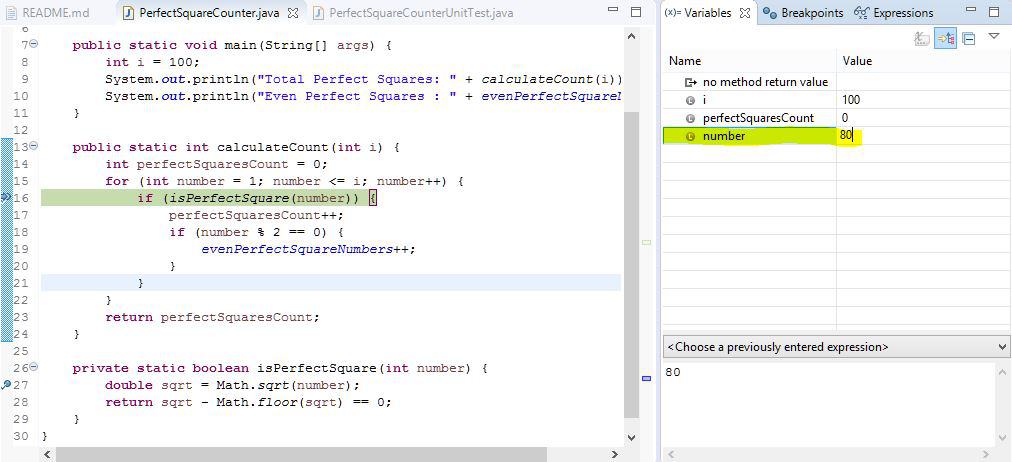
Using the variables view, it’s possible to change any value to the desired value during the execution.
使用变量视图,有可能在执行过程中把任何值改为所需的值。
For example, if we need to skip a few numbers and directly start with the number 80, we could do that by changing the value of the variable number:
例如,如果我们需要跳过几个数字,直接从数字80开始,我们可以通过改变变量number的值来实现。
3.2. Inspecting Values
3.2.检查数值
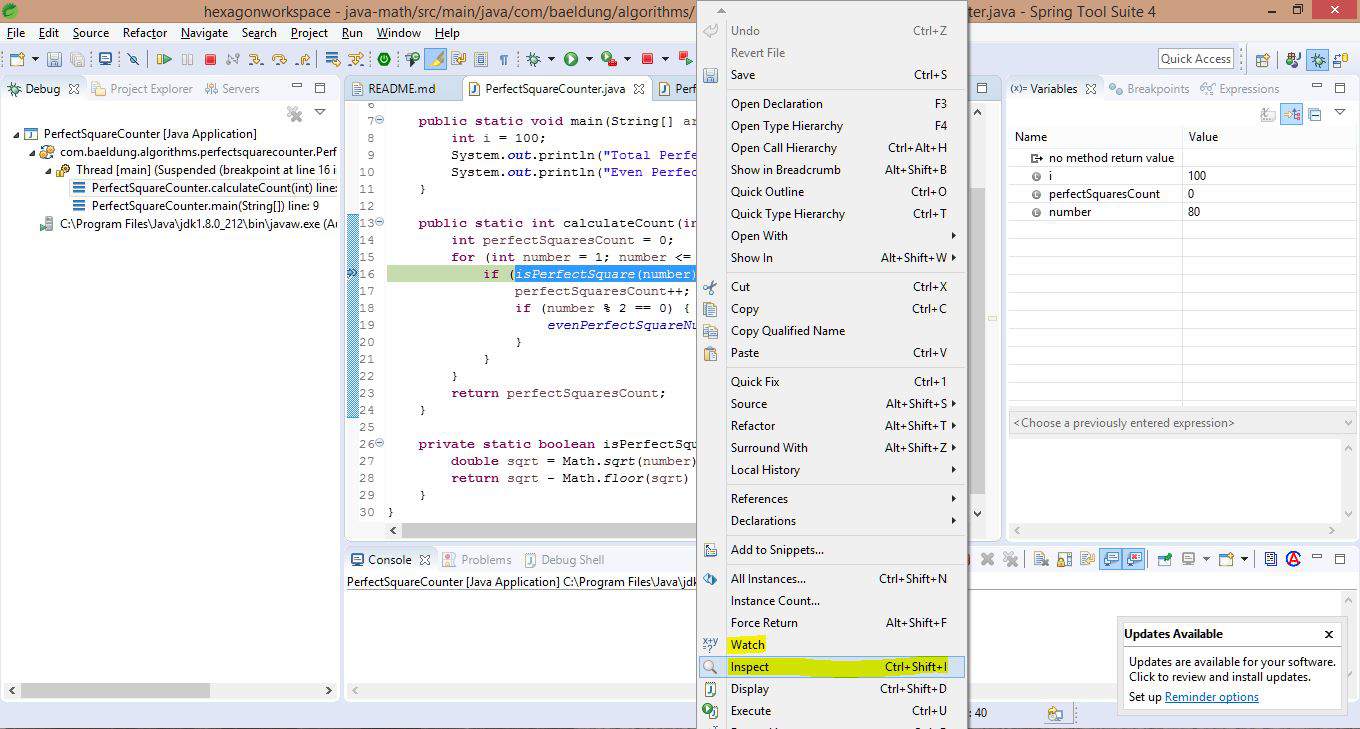
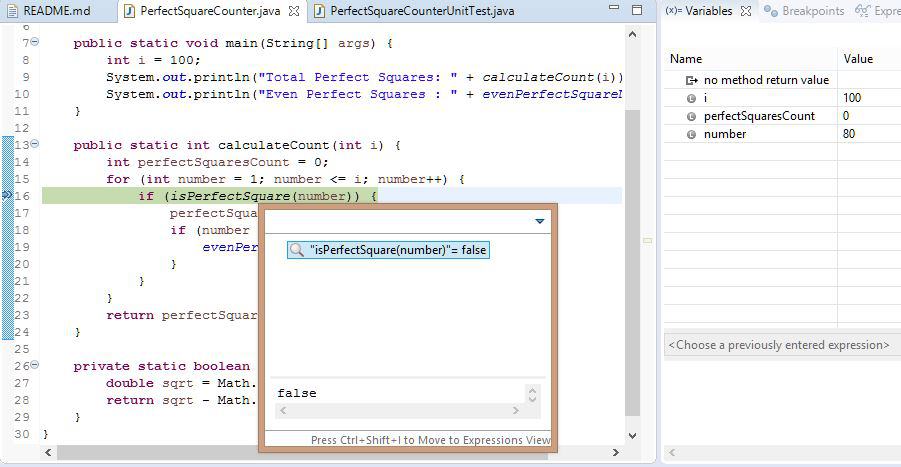
If we need to inspect the value of a Java expression or statement, we can select the particular expression in the editor, right-click, and Inspect, as shown below. A handy shortcut is to hit Ctrl+Shift+I on the expression to see the value:
如果我们需要检查一个Java表达式或语句的值,我们可以在编辑器中选择特定的表达式,右键单击,然后检查,如下所示。一个方便的快捷方式是在表达式上点击Ctrl+Shift+I来查看值:。
In case we need to permanently inspect this expression, we can right-click and Watch. Now, this gets added to the Expressions view and the value of this expression can be seen for different runs.
如果我们需要永久检查这个表达式,我们可以右键单击并观察。现在,这个表达式被添加到表达式视图中,可以看到这个表达式在不同运行中的值。
3.3. Debug Shell
3.3 调试外壳
In the context of the debugging session, we can write and run custom code to evaluate possibilities. This is done in the Debug Shell.
在调试会话的背景下,我们可以编写和运行自定义代码来评估各种可能性。这是在Debug Shell中完成。
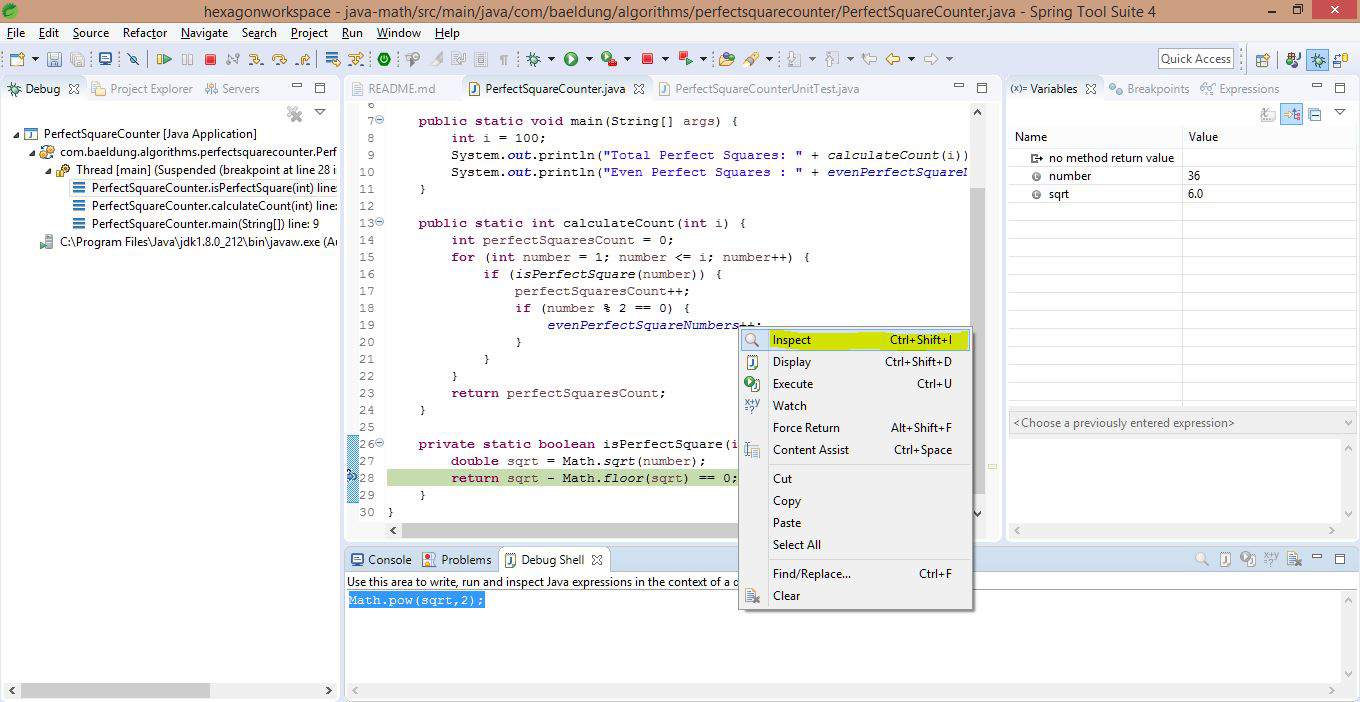
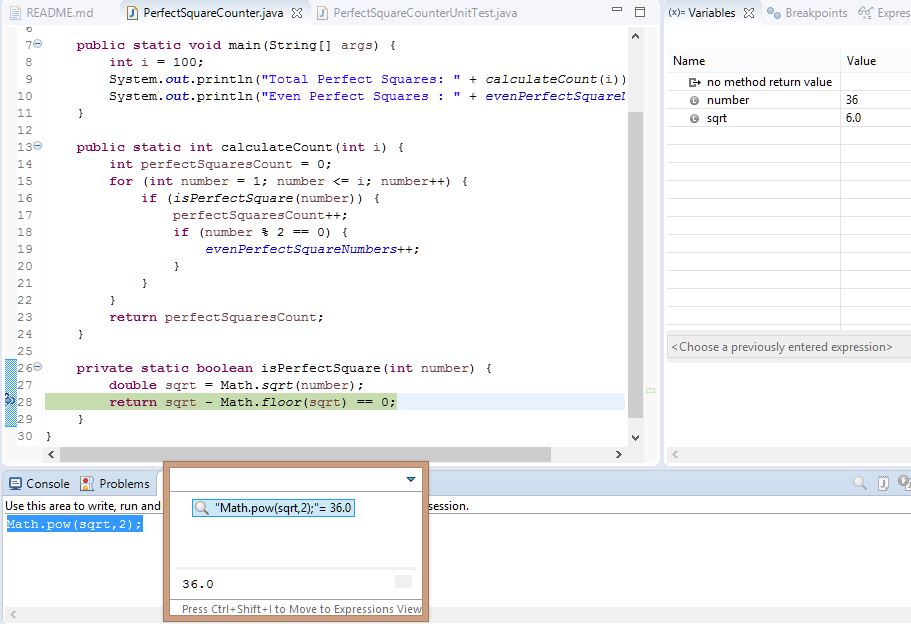
For example, if we need to cross-check the correctness of the sqrt functionality, we could do it in the Debug Shell. On the code, Right-click -> Inspect to see the value:
例如,如果我们需要交叉检查sqrt功能的正确性,我们可以在Debug Shell中进行。在代码上,右键单击->检查以查看值。
3.4. Conditional Breakpoints
3.4.条件性断点
There will be cases in which we want to debug only for specific conditions. We can achieve this by adding conditions to a breakpoint in one of two ways:
在有些情况下,我们只想对特定的条件进行调试。我们可以通过在断点上添加条件来实现这一点,有两种方法。
- Right-click on the breakpoint and choose Breakpoint Properties
- In Breakpoint view, select the breakpoint and specify the condition
For example, we can specify the breakpoint to suspend the execution only if number is equal to 10:
例如,我们可以指定断点,只在number等于10时暂停执行。
3.5. Watchpoints
3.5.观察点
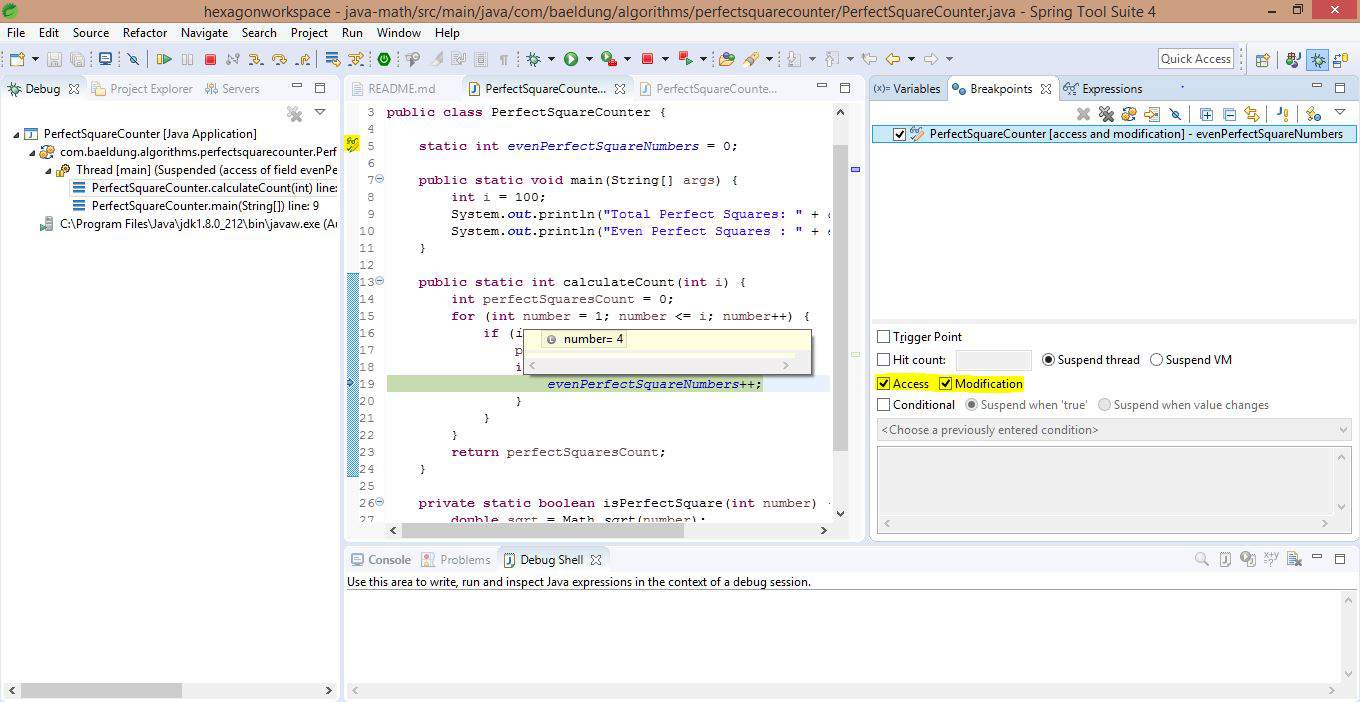
What breakpoints are for methods, watchpoints are for class-level variables. In this current example, the breakpoint on evenPerfectSquareNumbers declaration is called a watchpoint. Now, the debugger will pause the execution every time the field is accessed or modified on a watchpoint.
什么 断点是针对方法的,观察点是针对类级变量的。在当前的例子中,evenPerfectSquareNumbers声明上的断点被称为观察点。现在,每当观察点上的字段被访问或修改时,调试器就会暂停执行。
This is the default behavior, which can be changed in the watchpoint’s properties.
这是默认行为,可以在观察点的属性中改变。
In this example, the debugger will stop execution every time a perfect square is an even number:
在这个例子中,每当完全平方数是偶数时,调试器就会停止执行。
3.6. Trigger Points
3.6.触发点
Let’s assume that we’re debugging a complex issue in an application with a huge amount of source code. The debugger will keep suspending the flow due to scattered breakpoints.
假设我们正在调试一个有大量源代码的应用程序中的一个复杂问题。调试器会因为分散的断点而不断暂停流程。
When a breakpoint is marked as a trigger point, it means that the rest of the breakpoints will be enabled only if this breakpoint is hit.
当一个断点被标记为触发点时,这意味着只有当这个断点被击中时,其余的断点才会被启用。
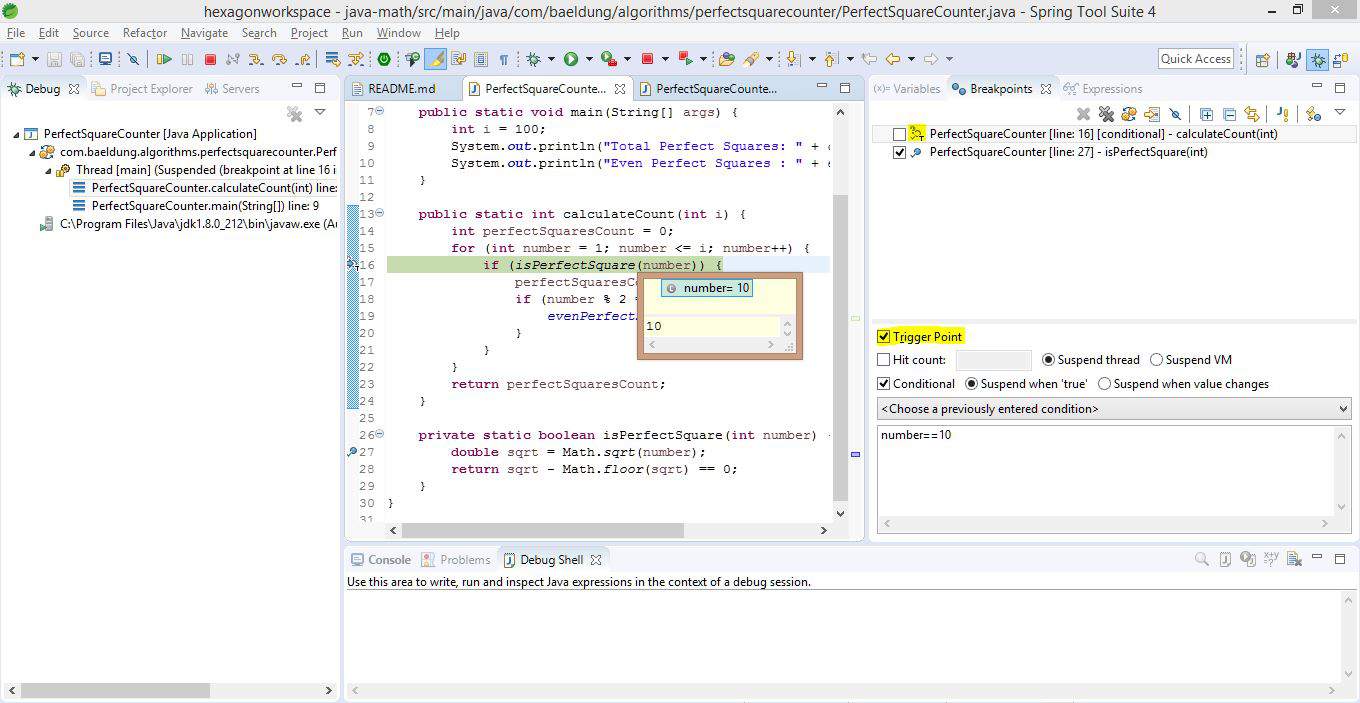
For example, in the screenshot below, the breakpoint on isPerfectSquare() is supposed to be hit for every iteration in the loop. However, we’ve specified the breakpoint on calculateCount() method as a trigger point, along with a condition.
例如,在下面的截图中,isPerfectSquare()上的断点应该在循环的每个迭代中被击中。然而,我们指定了calculateCount()方法上的断点作为触发点,同时还有一个条件。
So, when the iteration count reaches 10, this will trigger the rest of the breakpoints. Hence, from now on, if the breakpoint on isPerfectSquare() is hit, the execution will get suspended:
因此,当迭代次数达到10时,将触发其余的断点。因此,从现在开始,如果isPerfectSquare()的断点被击中,执行将被暂停。
3.7. Remote Debugging
3.7.远程调试
Finally, if the application is running outside Eclipse, we can still use all the above functionalities, provided that the remote application allows debugging. From Eclipse, we would select Debug as Remote Java Application.
最后,如果应用程序在Eclipse之外运行,我们仍然可以使用上述所有功能,只要远程应用程序允许调试。在Eclipse中,我们将选择Debug as Remote Java Application。
4. Conclusion
4.总结
In this quick guide, we’ve seen the basics and different techniques of debugging programs in Eclipse IDE.
在这个快速指南中,我们已经看到了在Eclipse IDE中调试程序的基础知识和不同的技术。
As always, the source code used in this exercise is available over on GitHub.
像往常一样,本练习中使用的源代码可在GitHub上获得。
