1. Overview
1.概述
In this tutorial, we’ll examine Java Flight Recorder, its concepts, its basic commands, and how to use it.
在本教程中,我们将研究Java飞行记录器,它的概念,它的基本命令,以及如何使用它。
2. Java Monitoring Utilities
2.Java监控实用程序
Java is not just a programming language but a very rich ecosystem with a lot of tools. The JDK contains programs that allow us to compile our own programs, as well as monitor their state and the state of the Java Virtual Machine during the full life cycle of program execution.
Java不仅是一种编程语言,而且是一个非常丰富的生态系统,有很多的工具。JDK包含的程序允许我们编译自己的程序,以及在程序执行的整个生命周期中监控其状态和Java虚拟机的状态。
The bin folder of a JDK distribution contains, among others, the following programs that can be used for profiling and monitoring:
JDK 发行版的 bin 文件夹除其他外,还包含以下可用于分析和监控的程序。
- Java VisualVM (jvisualvm.exe)
- JConsole (jconsole.exe)
- Java Mission Control (jmc.exe)
- Diagnostic Command Tool (jcmd.exe)
We suggest exploring the content of this folder to be aware of what tools we have at our disposal. Please note that the Java VisualVM was part of the Oracle and Open JDK distributions in the past. However, starting from Java 9, JDK distributions no longer ship with Java VisualVM. Therefore, we should download it separately from the VisualVM open source project website.
我们建议探索这个文件夹的内容,了解我们有哪些工具可以使用。请注意,在过去,Java VisualVM是Oracle和Open JDK发行版的一部分。然而,从Java 9开始,JDK发行版不再附带Java VisualVM。因此,我们应该从VisualVM开源项目网站单独下载它。
In this tutorial, we’ll focus on the Java Flight Recorder. This isn’t present among the tools mentioned above because it isn’t a standalone program. Its usage is closely related to two of the tools above — Java Mission Control and Diagnostic Command Tools.
在本教程中,我们将重点介绍Java飞行记录器。这并没有出现在上面提到的工具中,因为它不是一个独立的程序。它的使用与上面的两个工具密切相关–Java任务控制和诊断命令工具。
3. Java Flight Recorder and Its Basic Concepts
3.Java飞行记录仪及其基本概念
Java Flight Recorder (JFR) is a monitoring tool that collects information about the events in a Java Virtual Machine (JVM) during the execution of a Java application. JFR is part of the JDK distribution, and it’s integrated into the JVM.
Java Flight Recorder(JFR)是一个监控工具,它收集Java应用程序执行期间Java虚拟机(JVM)中的事件信息。JFR是JDK发行版的一部分,它被集成到JVM中。
JFR is designed to affect the performance of a running application as little as possible.
JFR的设计是为了尽可能少地影响运行中的应用程序的性能。
In order to use JFR, we should activate it. We may achieve this in two ways:
为了使用JFR,我们应该激活它。我们可以通过两种方式实现这一点。
- when starting a Java application
- passing diagnostic commands of the jcmd tool when a Java application is already running
JFR doesn’t have a standalone tool. We use Java Mission Control (JMC), which contains a plugin that allows us to visualize the data collected by JFR.
JFR并没有一个独立的工具。我们使用Java任务控制(JMC),它包含一个插件,使我们能够将JFR收集的数据可视化。
These three components — JFR, jcmd and JMC — form a complete suite for collecting low-level runtime information of a running Java program. We may find this information very useful when optimizing our program, or when diagnosing it when something goes wrong.
这三个组件–JFR、jcmd和JMC–构成了一个完整的套件,用于收集运行中的Java程序的低级运行时信息。在优化我们的程序时,或者在程序出错时进行诊断时,我们会发现这些信息非常有用。
If we have various versions of Java installed on our computer, it’s important to make sure that the Java compiler (javac), the Java launcher (java) and the above-mentioned tools (JFR, jcmd and JMC) are from the same Java distribution. Otherwise, there’s a risk of not being able to see any useful data because the JFR data formats of different versions might be not compatible.
如果我们的电脑上安装了不同版本的Java,那么必须确保Java编译器(javac)、Java启动器(java)和上述工具(JFR、jcmd和JMC)都来自同一个Java发行版。否则,有可能无法看到任何有用的数据,因为不同版本的JFR数据格式可能不兼容。
JFR has two main concepts: events and dataflow. Let’s briefly discuss them.
JFR有两个主要的概念:事件和数据流。让我们简单地讨论一下它们。
3.1. Events
3.1.活动
JFR collects events that occur in the JVM when the Java application runs. These events are related to the state of the JVM itself or the state of the program. An event has a name, a timestamp, and additional information (like thread information, execution stack, and state of the heap).
JFR收集Java应用程序运行时在JVM中发生的事件。这些事件与JVM本身的状态或程序的状态有关。一个事件有一个名称、一个时间戳和其他信息(如线程信息、执行栈和堆的状态)。
There are three types of events that JFR collects:
JFR收集的事件有三种类型。
- an instant event is logged immediately once it occurs
- a duration event is logged if its duration succeeds a specified threshold
- a sample event is used to sample the system activity
3.2. Dataflow
3.2. 数据流
The events that JFR collects contain a huge amount of data. For this reason, by design, JFR is fast enough to not impede the program.
JFR所收集的事件包含了大量的数据。出于这个原因,通过设计,JFR的速度足够快,不会妨碍程序的运行。
JFR saves data about the events in a single output file, flight.jfr.
JFR将有关事件的数据保存在一个输出文件中,flight.jfr。
As we know, disk I/O operations are quite expensive. Therefore, JFR uses various buffers to store the collected data before flushing the blocks of data to disk. Things might become a little bit more complex because, at the same moment, a program might have multiple registering processes with different options.
正如我们所知,磁盘I/O操作是相当昂贵的。因此,JFR使用各种缓冲区来存储所收集的数据,然后再将数据块冲到磁盘上。事情可能变得有点复杂,因为在同一时刻,一个程序可能有多个具有不同选项的注册进程。
Because of this, we may find more data in the output file than requested, or it may not be in chronological order. We might not even notice this fact if we use JMC, because it visualizes the events in chronological order.
正因为如此,我们可能在输出文件中发现比要求的更多的数据,或者它可能不是按时间顺序排列的。如果我们使用JMC,我们甚至可能不会注意到这个事实,因为它是按时间顺序来可视化事件的。
In some rare cases, JFR might fail to flush the data (for example, when there are too many events or in a case of a power outage). If this occurs, JFR tries to inform us that the output file might be missing a piece of data.
在一些罕见的情况下,JFR可能无法刷新数据(例如,当有太多的事件或在停电的情况下)。如果发生这种情况,JFR会试着通知我们,输出文件可能缺少一段数据。
4. How to Use Java Flight Recorder
4.如何使用Java飞行记录器
JFR is an experimental feature, hence its use is subject to change. In fact, in earlier distributions, we have to activate commercial features in order to use it in production. However, starting from JDK 11, we may use it without activating anything. We can always consult the official Java release notes to check how to use this tool.
JFR是一个实验性的功能,因此它的使用会有变化。事实上,在早期的发行版中,我们必须激活商业功能,才能在生产中使用它。然而,从JDK 11开始,我们可以不激活任何东西就使用它。我们可以随时查阅官方的Java发行说明来检查如何使用这个工具。
For JDK 8, to be able to activate JFR, we should start the JVM with the options +UnlockCommercialFeatures and +FlightRecorder.
对于JDK 8,为了能够激活JFR,我们应该用+UnlockCommercialFeatures和+FlightRecorder选项启动JVM。
As we’ve mentioned above, there are two ways to activate JFR. When we activate it simultaneously with starting the application, we do it from the command line. When the application is already running, we use the diagnostic command tool.
正如我们上面提到的,有两种方法来激活JFR。当我们在启动应用程序的同时激活它时,我们从命令行中进行。当应用程序已经在运行时,我们使用诊断命令工具。
4.1. Command Line
4.1.命令行
First, we compile the program’s *.java file into a *.class using the standard java compiler javac.
首先,我们使用标准的java编译器javac将程序的*.java文件编译成*.class。
Once the compilation succeeds, we may start the program with the following options:
一旦编译成功,我们可以用以下选项启动程序。
java -XX:+UnlockCommercialFeatures -XX:+FlightRecorder
  -XX:StartFlightRecording=duration=200s,filename=flight.jfr path-to-class-file
where path-to-class-file is the application’s entry point *.class file.
其中path-to-class-file是应用程序的入口*.class文件。
This command launches the application and activates the recording, which starts immediately and lasts no more than 200 seconds. Collected data is saved in an output file, flight.jfr. We’ll describe the other options in more detail in the next section.
这个命令启动了应用程序,并激活了记录,记录立即开始,持续时间不超过200秒。收集的数据被保存在一个输出文件中,flight.jfr。我们将在下一节更详细地描述其他选项。
4.2. Diagnostic Command Tool
4.2.诊断命令工具
We can also start registering the events by using the jcmd tool. For example:
我们也可以通过使用jcmd工具开始注册事件。比如说。
jcmd 1234 JFR.start duration=100s filename=flight.jfrPrior to JDK 11, in order to be able to activate JFR in this way, we should start the application with unlocked commercial features:
在JDK 11之前,为了能够以这种方式激活JFR,我们应该以未锁定的商业功能启动应用程序。
java -XX:+UnlockCommercialFeatures -XX:+FlightRecorder -cp ./out/ com.baeldung.MainOnce the application is running, we use its process id in order to execute various commands, which take the following format:
一旦应用程序运行,我们使用它的进程ID,以执行各种命令,其格式如下。
jcmd <pid|MainClass> <command> [parameters]Here’s a complete list of the diagnostic commands:
下面是诊断命令的完整列表。
- JFR.start – starts a new JFR recording
- JFR.check – checks running JFR recording(s)
- JFR.stop – stops a specific JFR recording
- JFR.dump – copies contents of a JFR recording to file
Each command has a series of parameters. For example, the JFR.start command has the following parameters:
每个命令都有一系列的参数。例如,JFR.start命令有以下参数。
- name – the name of the recording; it serves to be able to reference this recording later with other commands
- delay – dimensional parameter for a time delay of recording start, the default value is 0s
- duration – dimensional parameter for a time interval of the duration of the recording; the default value is 0s, which means unlimited
- filename – the name of a file that contains the collected data
- maxage – dimensional parameter for the maximum age of collected data; the default value is 0s, which means unlimited
- maxsize – the maximum size of buffers for collected data in bytes; the default value is 0, which means no max size
We’ve already seen an example of the usage of these parameters at the beginning of this section. For the complete list of the parameters, we may always consult the Java Flight Recorded official documentation.
我们已经在本节开头看到了这些参数的使用实例。关于参数的完整列表,我们可以随时查阅Java飞行记录的官方文档。
Although JFR is designed to have as little of a footprint as possible on the performance of the JVM and the application, it’s better to limit the maximum amount of collected data by setting at least one of the parameters: duration, maxage, or maxsize.
尽管JFR被设计成对JVM和应用程序的性能有尽可能小的影响,但最好通过设置至少一个参数来限制收集数据的最大数量。duration, maxage, or maxsize.
5. Java Flight Recorder in Action
5.Java飞行记录器在行动
Let’s now demonstrate JFR in action by using an example program.
现在让我们用一个实例程序来演示JFR的操作。
5.1. Example Program
5.1.示例程序
Our program inserts objects into a list until an OutOfMemoryError occurs. Then the program sleeps for one second:
我们的程序将对象插入一个列表中,直到发生OutOfMemoryError。然后,程序会休眠一秒钟。
public static void main(String[] args) {
    List<Object> items = new ArrayList<>(1);
    try {
        while (true){
            items.add(new Object());
        }
    } catch (OutOfMemoryError e){
        System.out.println(e.getMessage());
    }
    assert items.size() > 0;
    try {
        Thread.sleep(1000);
    } catch (InterruptedException e) {
        System.out.println(e.getMessage());
    }
}
Without executing this code, we can spot a potential drawback: the while loop will lead to high CPU and memory usage. Let’s use JFR to see these drawbacks and probably find others.
不执行这段代码,我们可以发现一个潜在的缺点:while循环将导致CPU和内存的高使用率。让我们用JFR来看看这些缺点,并可能发现其他的缺点。
5.2. Start Registering
5.2.开始注册
First, we compile our program by executing the following command from the command line:
首先,我们通过在命令行中执行以下命令来编译我们的程序。
javac -d out -sourcepath src/main src/main/com/baeldung/flightrecorder/FlightRecorder.javaAt this point, we should find a file FlightRecorder.class in the out/com/baeldung/flightrecorder directory.
在这一点上,我们应该在out/com/baeldung/flightrecorder目录下找到一个文件FlightRecorder.class。
Now, we’ll start the program with the following options:
现在,我们将用以下选项启动该程序。
java -XX:+UnlockCommercialFeatures -XX:+FlightRecorder
  -XX:StartFlightRecording=duration=200s,filename=flight.jfr
  -cp ./out/ com.baeldung.flightrecorder.FlightRecorder
5.3. Visualize Data
5.3.可视化数据
Now, we feed the file flight.jfr to Java Mission Control, which is part of the JDK distribution. It helps us visualize the data about our events in a nice and intuitive way.
现在,我们把文件flight.jfr送到Java Mission Control,它是JDK发行版的一部分。它可以帮助我们以一种很好的、直观的方式可视化关于我们事件的数据。
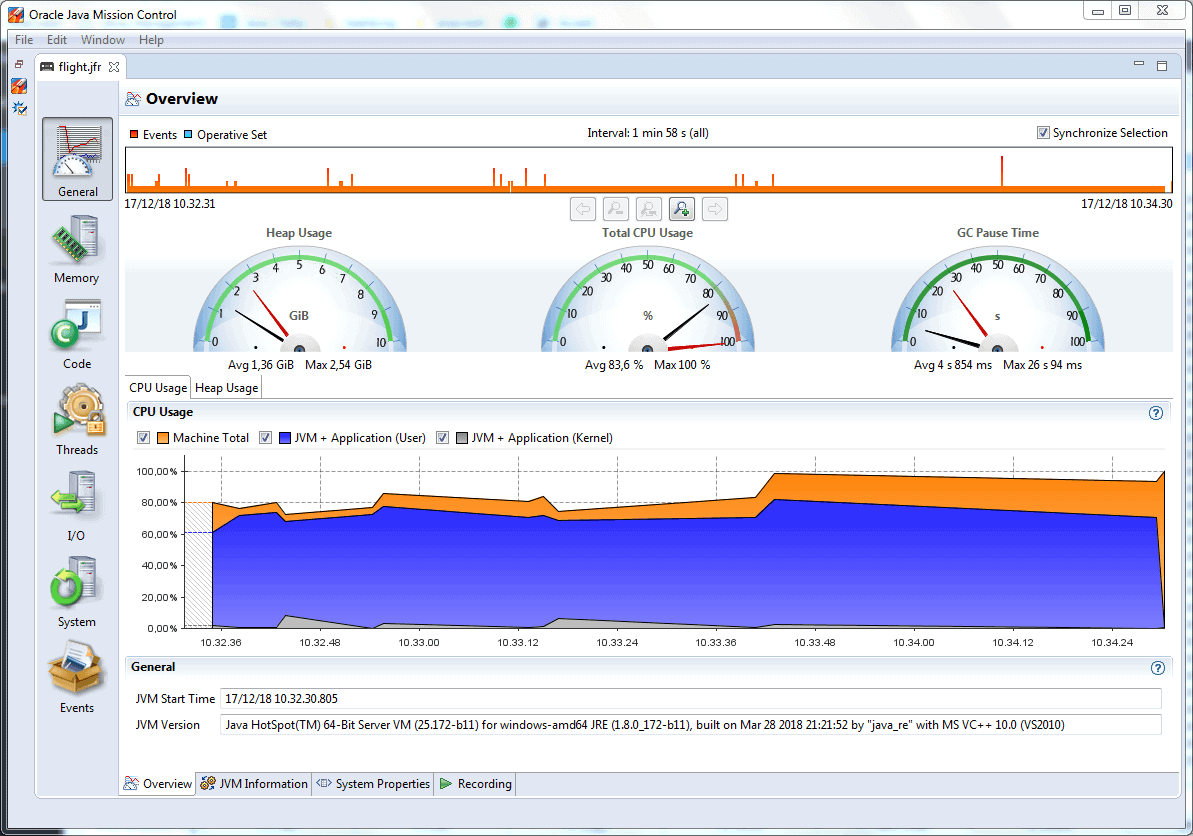
Its main screen shows us the information about how the program was using the CPU during its execution. We see that the CPU was loaded heavily, which is quite expected due to the while loop:
它的主屏幕向我们显示了该程序在执行过程中如何使用CPU的信息。我们看到,由于while循环的存在,CPU被大量加载,这是在意料之中的。
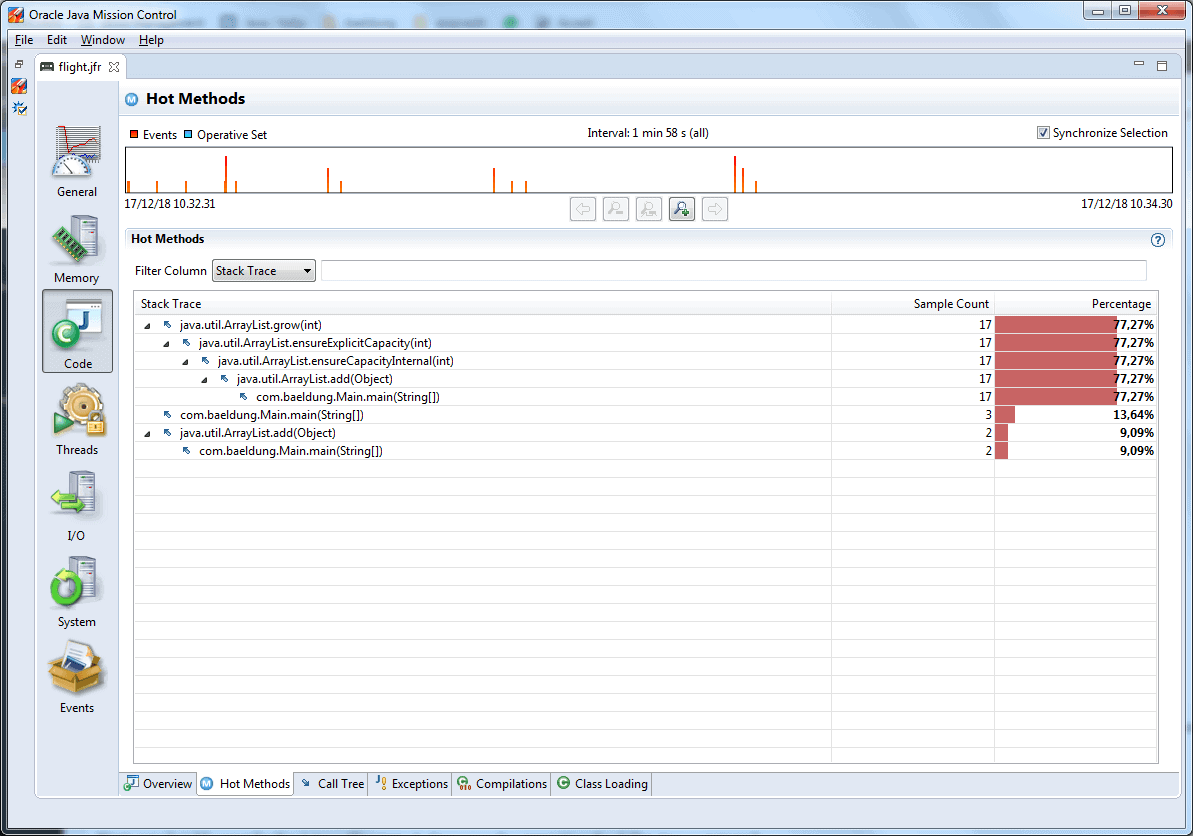
On the left side of the view, we see sections General, Memory, Code, and Threads, among others. Each section contains various tabs with detailed information. For example, tab Hot Methods of section Code contains the statistics of method calls:
在视图的左侧,我们看到General、Memory、Code、Threads等部分。每个部分都包含各种标签,有详细信息。例如,Code部分的Hot Methods标签包含方法调用的统计数据。
In this tab, we can spot another drawback of our example program: method java.util.ArrayList.grow(int) has been called 17 times in order to enlarge the array capacity every time there wasn’t enough space for adding an object.
在这个标签中,我们可以发现我们的示例程序的另一个缺点:方法java.util.ArrayList.grow(int)已经被调用了17次,以便在每次没有足够的空间添加对象时扩大数组的容量。
In more realistic programs, we may see a lot of other useful information:
在更现实的程序中,我们可能会看到很多其他有用的信息。
- statistics about created objects, when they were created and destroyed by the garbage collector
- a detailed report about the threads’ chronology, when they were locked or active
- which I/O operations the application was executing
6. Conclusion
6.结语
In this article, we introduced the topic of monitoring and profiling a Java application using Java Flight Recorder. This tool remains an experimental one, so we should consult its official site for more complete and recent information.
在这篇文章中,我们介绍了使用Java Flight Recorder对Java应用程序进行监控和分析的话题。这个工具仍然是一个实验性的工具,所以我们应该查阅它的官方网站,以获得更完整和最新的信息。
As always, the code snippet is available over on our Github repository.
一如既往,代码片段可在我们的Github资源库中找到。

