1. Overview
1.概述
In this tutorial, we’ll discuss various ways to capture the thread dump of a Java application.
在本教程中,我们将讨论捕获Java应用程序的线程转储的各种方法。
A thread dump is a snapshot of the state of all the threads of a Java process. The state of each thread is presented with a stack trace, showing the content of a thread’s stack. A thread dump is useful for diagnosing problems, as it displays the thread’s activity. Thread dumps are written in plain text, so we can save their contents to a file and look at them later in a text editor.
线程转储是一个Java进程中所有线程的状态快照。每个线程的状态都有一个堆栈跟踪,显示一个线程的堆栈内容。线程转储对于诊断问题非常有用,因为它显示了线程的活动。线程转储是以纯文本形式写入的,因此我们可以将其内容保存到文件中,以后用文本编辑器查看。
In the next sections, we’ll go through multiple tools and approaches to generate a thread dump.
在接下来的章节中,我们将通过多种工具和方法来生成线程转储。
2. Using JDK Utilities
2.使用JDK实用程序
The JDK provides several utilities that can capture the thread dump of a Java application. All of the utilities are located under the bin folder inside the JDK home directory. Therefore, we can execute these utilities from the command line as long as this directory is in our system path.
JDK 提供了几个工具,可以捕获 Java 应用程序的线程转储。所有的实用程序都位于JDK主目录下的bin文件夹中。因此,只要这个目录在我们的系统路径中,我们就可以从命令行中执行这些实用程序。
2.1. jstack
2.1. jstack
jstack is a command-line JDK utility we can use to capture a thread dump. It takes the pid of a process and displays the thread dump in the console. Alternatively, we can redirect its output to a file.
jstack是一个命令行JDK工具,我们可以用来捕获线程转储。它接收一个进程的pid,并在控制台中显示线程转储。另外,我们也可以将其输出重定向到一个文件。
Let’s take a look at the basic command syntax for capturing a thread dump using jstack:
让我们来看看使用jstack捕获线程转储的基本命令语法:。
jstack [-F] [-l] [-m] <pid>All the flags are optional. Let’s see what they mean:
所有的旗帜都是可选的。让我们看看它们的含义。
- -F option forces a thread dump; handy to use when jstack pid doesn’t respond (the process is hung)
- -l option instructs the utility to look for ownable synchronizers in the heap and locks
- -m option prints native stack frames (C & C++) in addition to the Java stack frames
Let’s put this knowledge to use by capturing a thread dump and redirecting the result to a file:
让我们通过捕捉线程转储并将结果重定向到一个文件来使用这些知识。
jstack 17264 > /tmp/threaddump.txtRemember that we can easily get the pid of a Java process by using the jps command.
请记住,我们可以通过使用jps 命令,轻松获得一个Java进程的pid。
2.2. Java Mission Control
2.2.Java任务控制
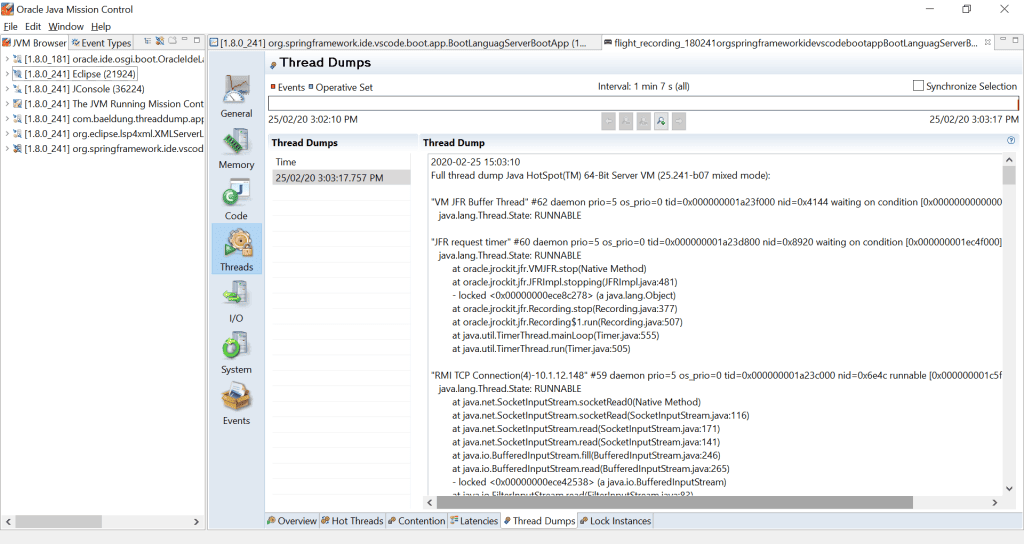
Java Mission Control (JMC) is a GUI tool that collects and analyzes data from Java applications. After we launch JMC, it displays the list of Java processes running on a local machine. We can also connect to remote Java processes through JMC.
Java Mission Control(JMC)是一个GUI工具,用于收集和分析来自Java应用程序的数据。我们启动JMC后,它会显示本地机器上运行的Java进程列表。我们还可以通过JMC连接到远程Java进程。
We can right-click on the process and click on the “Start Flight Recording” option. After this, the Threads tab shows the Thread Dumps:
我们可以右击该进程,点击”Start Flight Recording“选项。之后,线程标签显示线程转储。
2.3. jvisualvm
2.3.jvisualvm
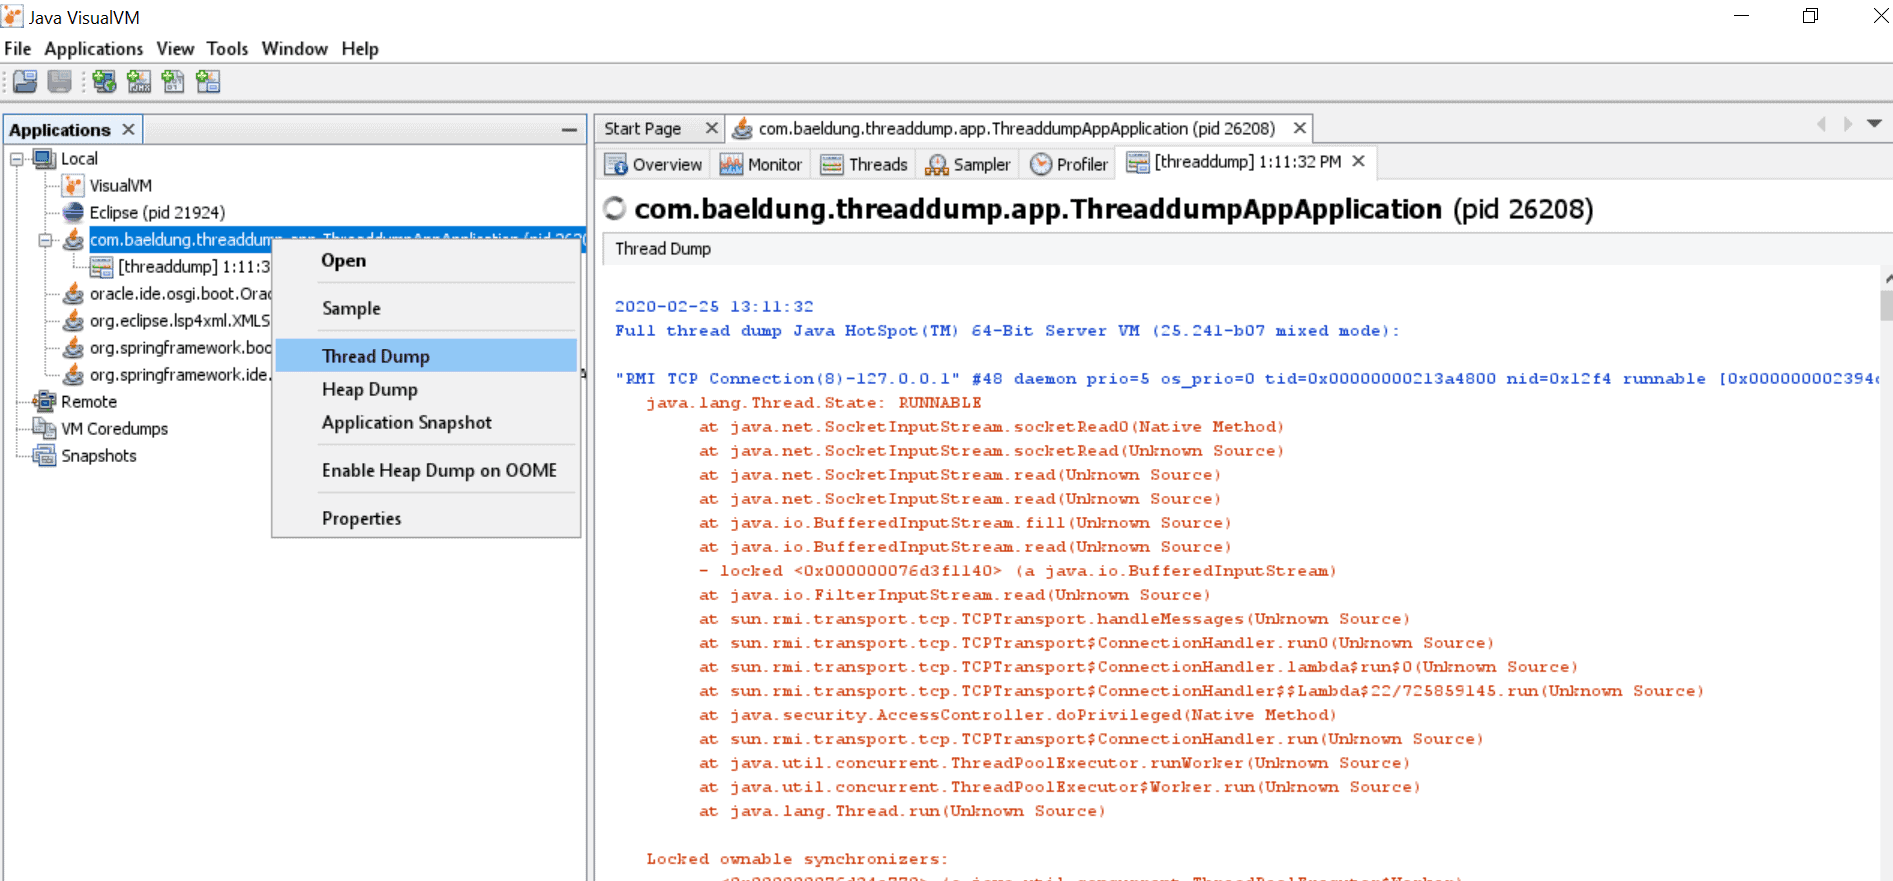
jvisualvm is a tool with a graphical user interface that lets us monitor, troubleshoot, and profile Java applications. The GUI is simple, but very intuitive and easy to use.
jvisualvm是一个具有图形用户界面的工具,可以让我们对Java应用程序进行监控、故障排除和剖析。该图形用户界面很简单,但非常直观,易于使用。
One of its many options allows us to capture a thread dump. If we right-click on a Java process and select the “Thread Dump” option, the tool will create a thread dump and open it in a new tab:
它的许多选项之一允许我们捕获一个线程转储。如果我们右击一个Java进程并选择“线程转储”选项,该工具将创建一个线程转储并在一个新的标签中打开。
As of JDK 9, Visual VM isn’t included in the Oracle JDK and Open JDK distributions. Therefore, if we’re using Java 9 or newer versions, we can get the JVisualVM from the Visual VM open source project site.
从JDK 9开始,Visual VM不包括在Oracle JDK和Open JDK发行版中。因此,如果我们使用Java 9或更新的版本,我们可以从Visual VM开源项目网站获得JVisualVM。
2.4. jcmd
2.4 jcmd
jcmd is a tool that works by sending command requests to the JVM. Although powerful, it doesn’t contain any remote functionality; we have to use it in the same machine where the Java process is running.
jcmd是一个通过向JVM发送命令请求来工作的工具。虽然功能强大,但它不包含任何远程功能;我们必须在运行Java进程的同一台机器上使用它。
One of its many commands is Thread.print. We can use it to get a thread dump just by specifying the pid of the process:
它的许多命令之一是 Thread.print。我们可以通过指定进程的pid来获得一个线程转储。
jcmd 17264 Thread.print2.5. jconsole
2.5.jconsole
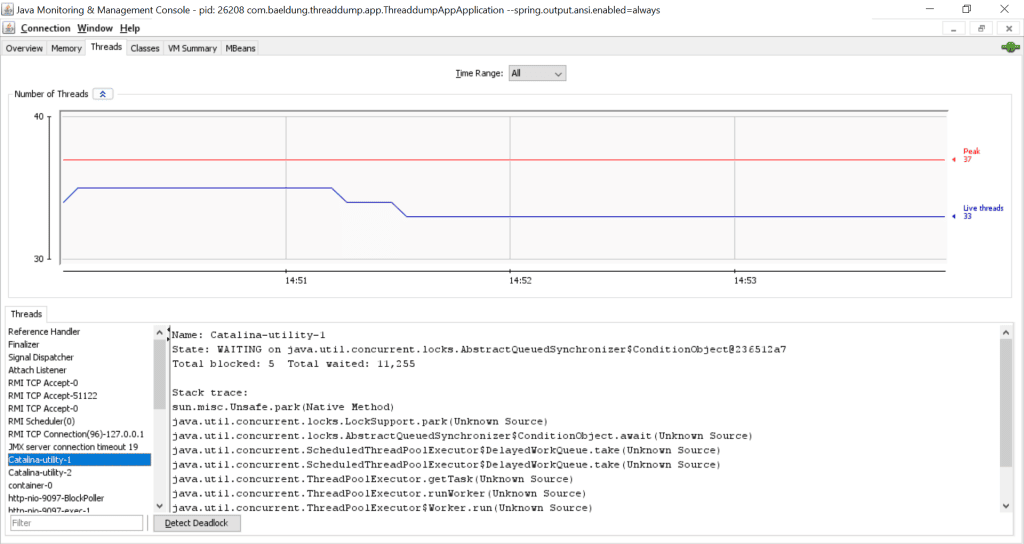
jconsole lets us inspect the stack trace of each thread. If we open jconsole and connect to a running Java process, we can navigate to the Threads tab and find each thread’s stack trace:
jconsole可以让我们检查每个线程的堆栈跟踪。如果我们打开jconsole并连接到一个正在运行的Java进程,我们可以导航到Threads标签并找到每个线程的堆栈跟踪。
2.6. Summary
2.6.摘要
As it turns out, there are many ways to capture a thread dump using JDK utilities. Let’s take a moment to reflect on each and outline their pros and cons:
事实证明,有很多方法可以使用JDK工具来捕获线程转储。让我们花点时间来思考每一种方法,并概述其优点和缺点。
- jstack: provides the quickest and easiest way to capture a thread dump; however, better alternatives are available starting with Java 8
- jmc: enhanced JDK profiling and diagnostics tool. It minimizes the performance overhead that’s usually an issue with profiling tools.
- jvisualvm: lightweight and open-source profiling tool with an excellent GUI console
- jcmd: extremely powerful and recommended for Java 8 and later. A single tool that serves many purposes: capturing thread dump (jstack), heap dump (jmap), system properties, and command-line arguments (jinfo)
- jconsole: lets us inspect thread stack trace information
3. From the Command Line
3.从命令行中
In enterprise application servers, only the JRE is installed for security reasons. Thus, we can’t use the above-mentioned utilities, as they’re part of JDK. However, there are various command-line alternatives that let us capture thread dumps easily.
在企业应用服务器中,出于安全考虑,只有JRE被安装。因此,我们不能使用上述的实用程序,因为它们是JDK的一部分。然而,有各种命令行的替代品,可以让我们轻松捕获线程转储。
3.1. kill -3 Command (Linux/Unix)
3.1. kill -3 命令 (Linux/Unix)
The easiest way to capture a thread dump in Unix-like systems is through the kill command, which we can use to send a signal to a process using the kill() system call. In this use case, we’ll send it the -3 signal.
在类Unix系统中捕获线程转储的最简单方法是通过kill 命令,我们可以使用kill() 系统调用向进程发送一个信号。在这个用例中,我们将向它发送-3信号。
Using our same pid from earlier examples, let’s take a look at how to use kill to capture a thread dump:
使用前面例子中的同一个pid,让我们看看如何使用kill来捕获一个线程转储。
kill -3 17264This way the signal-receiving Java process will print the thread dump on the standard output.
这样,接收信号的Java进程将在标准输出上打印线程转储。
If we run the Java process with the following combination of tuning flags, then it’ll also redirect the thread dump to the given file:
如果我们用下面的调整标志组合运行Java进程,那么它也会将线程转储重定向到给定的文件。
-XX:+UnlockDiagnosticVMOptions -XX:+LogVMOutput -XX:LogFile=~/jvm.logNow if we send the -3 signal, in addition to the standard output, the dump will be available at ~/jvm.log file.
现在,如果我们发送-3信号,除了标准输出外,转储将可在~/jvm.log文件中获得。
3.2. Ctrl + Break (Windows)
3.2. Ctrl + Break (Windows)
In Windows operating systems, we can capture a thread dump using the CTRL and Break key combination. To take a thread dump, navigate to the console used to launch the Java application, and press the CTRL and Break keys together.
在Windows操作系统中,我们可以使用CTRL和Break组合键捕获线程转储。要捕获线程转储,请导航到用于启动Java应用程序的控制台,并同时按下CTRL和Break键。
It’s worth noting that, on some keyboards, the Break key isn’t available. Therefore, in such cases, a thread dump can be captured using the CTRL, SHIFT, and Pause keys together.
值得注意的是,在某些键盘上,Break键不可用。因此,在这种情况下,可以使用CTRL、SHIFT和Pause键一起捕获线程转储。
Both of these commands print the thread dump to the console.
这两个命令都将线程转储打印到控制台。
4. Programmatically Using ThreadMxBean
4.以编程方式使用ThreadMxBean
The last approach we’ll discuss in this article is using JMX. We’ll use ThreadMxBean to capture the thread dump. Let’s see it in code:
我们将在本文中讨论的最后一种方法是使用JMX。我们将使用ThreadMxBean来捕获线程转储。让我们看看它的代码。
private static String threadDump(boolean lockedMonitors, boolean lockedSynchronizers) {
    StringBuffer threadDump = new StringBuffer(System.lineSeparator());
    ThreadMXBean threadMXBean = ManagementFactory.getThreadMXBean();
    for(ThreadInfo threadInfo : threadMXBean.dumpAllThreads(lockedMonitors, lockedSynchronizers)) {
        threadDump.append(threadInfo.toString());
    }
    return threadDump.toString();
}
In the above program, we’re performing several steps:
在上述程序中,我们正在执行几个步骤。
- At first, an empty StringBuffer is initialized to hold the stack information of each thread.
- We then use the ManagementFactory class to get the instance of ThreadMxBean. A ManagementFactory is a factory class for getting managed beans for the Java platform. In addition, a ThreadMxBean is the management interface for the thread system of the JVM.
- Setting lockedMonitors and lockedSynchronizers values to true indicates to capture the ownable synchronizers and all locked monitors in the thread dump.
5. Conclusion
5.总结
In this article, we learned multiple ways to capture a thread dump.
在这篇文章中,我们学习了捕捉线程转储的多种方法。
First, we discussed various JDK Utilities, and then the command-line alternatives. Finally, we concluded with the programmatic approach using JMX.
首先,我们讨论了各种JDK工具,然后是命令行替代方案。最后,我们总结了使用JMX的程序化方法。
As always, the full source code of the example is available over on GitHub.
一如既往,该示例的完整源代码可在GitHub上获得。


