1. Overview
1.概述
In this article, we’re going to compare BitSets and boolean[] in terms of performance in different scenarios.
在本文中,我们将比较BitSets和boolean[] 在不同场景中的性能。
We usually use the term performance very loosely with different meanings in mind. Therefore, we’ll start by looking at various definitions of the term “performance”.
我们通常非常宽泛地使用性能这个词,心中有不同的含义。因此,我们先来看看 “绩效 “一词的各种定义。
Then, we’re going to use two different performance metrics for benchmarks: memory footprint and throughput. To benchmark the throughput, we’ll compare a few common operations on bit-vectors.
然后,我们将使用两个不同的性能指标作为基准:内存占用率和吞吐量。为了对吞吐量进行基准测试,我们将比较位向量上的一些常见操作。
2. Definition of Performance
2.绩效的定义
Performance is a very general term to refer to a wide range of “performance” related concepts!
绩效是一个非常笼统的术语,指的是一系列与 “绩效 “相关的概念!在这里,我想说的是,”绩效 “是一个非常广泛的概念。
Sometimes we use this term to talk about the startup speed of a particular application; that is, the amount of time the application takes before being able to respond to its first request.
有时我们使用这个术语来谈论某个特定应用程序的启动速度;也就是说,应用程序在能够响应其第一个请求之前所需的时间量。
In addition to startup speed, we may think about memory usage when we talk about performance. So the memory footprint is another aspect of this term.
除了启动速度之外,当我们谈论性能时,我们可能会想到内存使用情况。因此,内存足迹是这个术语的另一个方面。
It’s possible to interpret the “performance” as how “fast” our code works. So the latency is yet another performance aspect.
可以将 “性能 “解释为我们的代码工作得有多 “快”。因此,延迟是另一个性能方面。
For some applications, it’s very critical to know the system capacity in terms of operations per second. So the throughput can be another aspect of performance.
对于某些应用来说,了解以每秒操作数计算的系统容量是非常关键的。因此,吞吐量可以成为性能的另一个方面。
Some applications only after responding to a few requests and getting “warmed up” technically speaking, can operate on their peak performance level. Therefore, time to peak performance is another aspect.
一些应用程序只有在响应了一些请求并在技术上得到 “热身 “之后,才能在其峰值性能水平上运行。因此,t达到峰值性能的时间是另一个方面。
The list of possible definitions goes on and on! Throughout this article, however, we’re going to focus on only two performance metrics: memory footprint and throughput.
可能的定义不胜枚举。然而,在这篇文章中,我们将只关注两个性能指标。m内存占用率和吞吐量。
3. Memory Footprint
3.记忆的足迹
Although we might expect booleans to consume just one bit, each boolean in a boolean[] consumes one byte of memory. This is mainly to avoid word tearing and accessibility issues. Therefore, if we need a vector of bits, boolean[] will have a pretty significant memory footprint.
尽管我们可能期望booleans只消耗一个比特,boolean[] 中的每个boolean都会消耗一个字节的内存。这主要是为了避免字的撕裂和可访问性问题。因此,如果我们需要一个比特的向量,boolean[] 将会有相当大的内存占用。
To make matters more concrete, we can use Java Object Layout (JOL) to inspect the memory layout of a boolean[] with, say, 10,000 elements:
为了使事情更加具体,我们可以使用Java对象布局(JOL)来检查一个boolean[] 的内存布局,比如说,10,000个元素。
boolean[] ba = new boolean[10_000];
System.out.println(ClassLayout.parseInstance(ba).toPrintable());
This will print the memory layout:
这将打印内存布局。
[Z object internals:
 OFFSET  SIZE      TYPE DESCRIPTION               VALUE
      0     4           (object header)           01 00 00 00 (1)
      4     4           (object header)           00 00 00 00 (0)
      8     4           (object header)           05 00 00 f8 (-134217723)
     12     4           (object header)           10 27 00 00 (10000)
     16 10000   boolean [Z.                       N/A
Instance size: 10016 bytes
As shown above, this boolean[] consumes around 10 KB of memory.
如上所示,这个boolean[] 消耗了大约10KB的内存。
On the other hand, BitSet is using a combination of primitive data types (specifically long) and bitwise operations to achieve one bit per flag footprint. So a BitSet with 10,000 bits will consume much less memory compared to a boolean[] with the same size:
另一方面,BitSet使用原始数据类型(特别是long)和bitwise操作的组合来实现每一个标志位的占用率。因此,与具有相同大小的boolean[] 相比,具有10,000位的BitSet 所消耗的内存将少得多。
BitSet bitSet = new BitSet(10_000);
System.out.println(GraphLayout.parseInstance(bitSet).toPrintable());
Similarly, this will print the memory layout of the BitSet:
同样,这将打印BitSet的内存布局。
java.util.BitSet@5679c6c6d object externals:
          ADDRESS       SIZE TYPE             PATH
        76beb8190         24 java.util.BitSet
        76beb81a8       1272 [J               .words
As expected, the BitSet with the same number of bits consumes around 1 KB, which is far less than the boolean[].
正如预期的那样,具有相同位数的BitSet消耗了大约1KB,这远远低于boolean[]。
We can also compare the memory footprint for the different number of bits:
我们还可以比较不同位数的内存占用情况。
Path path = Paths.get("footprint.csv");
try (BufferedWriter stream = Files.newBufferedWriter(path, StandardOpenOption.CREATE)) {
    stream.write("bits,bool,bitset\n");

    for (int i = 0; i <= 10_000_000; i += 500) {
        System.out.println("Number of bits => " + i);

        boolean[] ba = new boolean[i];
        BitSet bitSet = new BitSet(i);

        long baSize = ClassLayout.parseInstance(ba).instanceSize();
        long bitSetSize = GraphLayout.parseInstance(bitSet).totalSize();

        stream.write((i + "," + baSize + "," + bitSetSize + "\n"));

        if (i % 10_000 == 0) {
            stream.flush();
        }
    }
}
The above code will compute the object size for both types of bit-vectors with different lengths. Then it writes and flushes the size comparisons to a CSV file.
上面的代码将计算两种不同长度的位向量的对象大小。然后,它将大小的比较结果写入并刷新到CSV文件中。
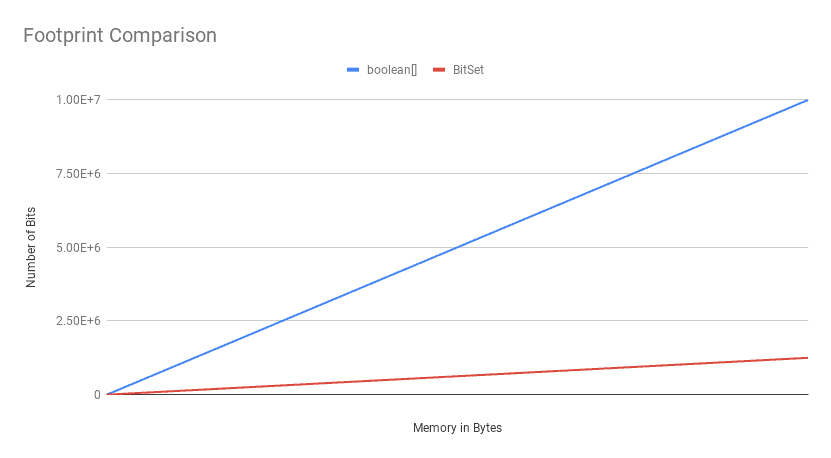
Now if we plot this CSV file, we’ll see that the absolute difference in memory footprint grows with the number of bits:
现在,如果我们绘制这个CSV文件,我们会看到内存占用的绝对差异随着比特数的增加而增长。
The key takeaway here is, the BitSet beats the boolean[] in terms of the memory footprint, except for a minimal number of bits.
这里的关键收获是,BitSet 在内存占用方面胜过boolean[] ,除了极少的比特之外。。
4. Throughput
4.吞吐量
To compare the throughput of BitSet and boolean[] with each other, we’ll conduct three benchmarks based on three different and yet everyday operations on bit-vectors:
为了比较BitSet 和boolean[] 的吞吐量,我们将根据对位向量的三种不同的日常操作,进行三项基准测试。
- Getting the value of a particular bit
- Setting or clearing the value of a specific bit
- Counting the number of set bits
This is the common setup we’re going to use for the throughput comparison of bit-vectors with different lengths:
这是我们要用来比较不同长度的比特向量的吞吐量的常用设置。
@State(Scope.Benchmark)
@BenchmarkMode(Mode.Throughput)
public class VectorOfBitsBenchmark {

    private boolean[] array;
    private BitSet bitSet;

    @Param({"100", "1000", "5000", "50000", "100000", "1000000", "2000000", "3000000",
      "5000000", "7000000", "10000000", "20000000", "30000000", "50000000", "70000000", "1000000000"})
    public int size;

    @Setup(Level.Trial)
    public void setUp() {
        array = new boolean[size];
        for (int i = 0; i < array.length; i++) {
            array[i] = ThreadLocalRandom.current().nextBoolean();
        }

        bitSet = new BitSet(size);
        for (int i = 0; i < size; i++) {
            bitSet.set(i, ThreadLocalRandom.current().nextBoolean());
        }
    }

    // omitted benchmarks
}
As shown above, we’re creating boolean[]s and BitSets with lengths in the 100-1,000,000,000 range. Also, after setting a few bits in the setup process, we’ll perform different operations on both the boolean[] and BitSets.
如上所示,我们正在创建长度在100-1,000,000,000范围内的boolean[]s和BitSets。另外,在设置过程中设置了几个比特后,我们将对boolean[]和BitSets执行不同的操作。
4.1. Getting a Bit
4.1.获得一个比特
At first glance, the direct memory access in boolean[] seems to be more efficient than performing two bitwise operations per get in BitSets (left-shift plus an and operation). On the other hand, memory compactness of BitSets may allow them to fit more values inside a cache line.
乍一看,boolean[] 中的直接内存访问似乎比在BitSets中对每个get执行两个位操作(左移加一个and操作)更有效率。另一方面,BitSets 的内存紧凑性可能允许它们在一个缓存行中容纳更多的值。
Let’s see which one wins! Here are the benchmarks that JMH will run with a different value of the size state each time:
让我们来看看哪一个会赢!下面是JMH将运行的基准,每次的size状态值不同。
@Benchmark
public boolean getBoolArray() {
    return array[ThreadLocalRandom.current().nextInt(size)];
}

@Benchmark
public boolean getBitSet() {
    return bitSet.get(ThreadLocalRandom.current().nextInt(size));
}
4.2. Getting a Bit: Throughput
4.2.获得一个比特:吞吐量
We’re going to run the benchmarks using the following command:
我们将使用下面的命令来运行基准测试。
$ java -jar jmh-1.0-SNAPSHOT.jar -f2 -t4 -prof perfnorm -rff get.csv getBitSet getBoolArrayThis will run the get-related benchmarks using four threads and two forks, profile their execution stats using the perf tool on Linux and outputs the result into the bench-get.csv file. The “-prof perfnorm” will profile the benchmark using the perf tool on Linux and normalizes the performance counters based on the number of operations.
这将使用四个线程和两个分叉运行与get相关的基准,使用Linux上的perf工具对其执行情况进行统计,并将结果输出到bench-get.csv文件中。“-prof perfnorm” 将使用Linux上的perf工具对基准进行剖析,并根据操作数对性能计数器进行归一化处理。
Since the command result is so verbose, we’re going only to plot them here. Before that, let’s see the basic structure of each benchmark result:
由于命令结果非常冗长,我们在这里只对它们进行绘图。在这之前,让我们看看每个基准结果的基本结构。
"Benchmark","Mode","Threads","Samples","Score","Score Error (99.9%)","Unit","Param: size"
"getBitSet","thrpt",4,40,184790139.562014,2667066.521846,"ops/s",100
"getBitSet:L1-dcache-load-misses","thrpt",4,2,0.002467,NaN,"#/op",100
"getBitSet:L1-dcache-loads","thrpt",4,2,19.050243,NaN,"#/op",100
"getBitSet:L1-dcache-stores","thrpt",4,2,6.042285,NaN,"#/op",100
"getBitSet:L1-icache-load-misses","thrpt",4,2,0.002206,NaN,"#/op",100
"getBitSet:branch-misses","thrpt",4,2,0.000451,NaN,"#/op",100
"getBitSet:branches","thrpt",4,2,12.985709,NaN,"#/op",100
"getBitSet:dTLB-load-misses","thrpt",4,2,0.000194,NaN,"#/op",100
"getBitSet:dTLB-loads","thrpt",4,2,19.132320,NaN,"#/op",100
"getBitSet:dTLB-store-misses","thrpt",4,2,0.000034,NaN,"#/op",100
"getBitSet:dTLB-stores","thrpt",4,2,6.035930,NaN,"#/op",100
"getBitSet:iTLB-load-misses","thrpt",4,2,0.000246,NaN,"#/op",100
"getBitSet:iTLB-loads","thrpt",4,2,0.000417,NaN,"#/op",100
"getBitSet:instructions","thrpt",4,2,90.781944,NaN,"#/op",100
As shown above, the result is a comma-separated list of fields each representing a metric. For instance, “thrpt” represents the throughput, “L1-dcache-load-misses” is the number of cache misses for the level 1 data cache, “L1-icache-load-misses” is the number of cache misses for the level 1 instruction cache, and “instructions” represents the number of CPU instructions for each benchmark. Also, the last field represents the number of bits, and the first one represents the benchmark method name.
如上所示,结果是一个以逗号分隔的字段列表,每个字段代表一个指标。例如,“thrept”代表吞吐量,“L1-dcache-load-misses”是1级数据缓存的缓存失误数,“L1-icache-load-misses”是1级指令缓存的缓存失误数,以及“指令”代表每个基准的CPU指令数量。另外,最后一个字段代表比特数,第一个字段代表基准方法名称。
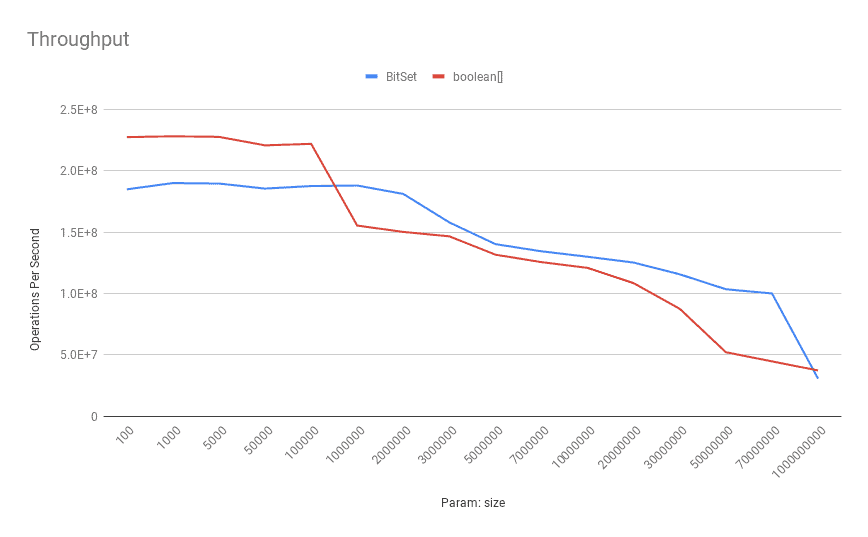
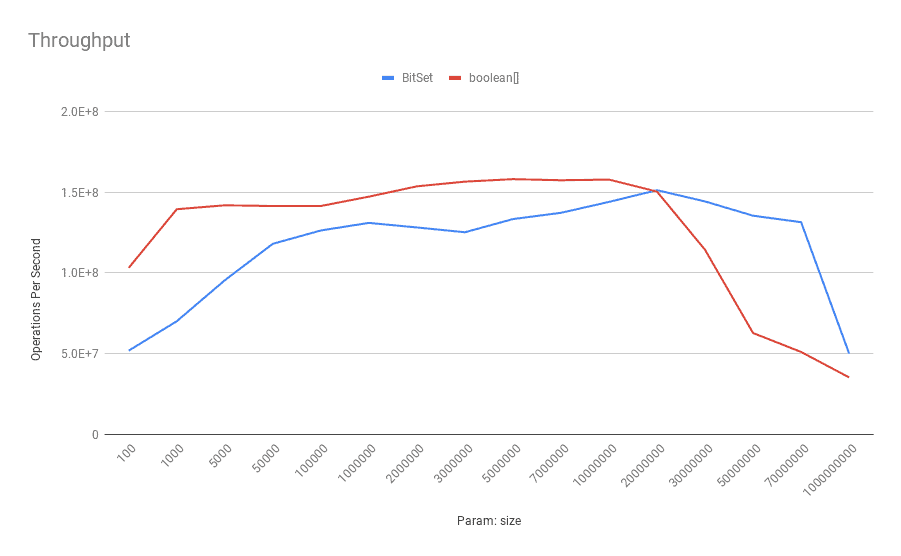
This is how the benchmark results look like for throughput on a typical Digitial Ocean droplet with a 4-core Intel(R) Xeon(R) CPU 2.20GHz:
这是一个典型的Digitial Ocean液滴上的吞吐量的基准结果,该液滴使用4核英特尔(R)至强(R)CPU 2.20GHz。
As shown above, the boolean[] has a better throughput on smaller sizes. When the number of bits increases, the BitSet outperforms the boolean[] in terms of throughput. To be more specific, after 100,000 bits, the BitSet shows superior performance.
如上所示,boolean[] 在较小的尺寸上有更好的吞吐量。当比特数增加时,BitSet在吞吐量方面优于boolean[] 。更具体地说,在100,000位之后,BitSet显示出更高的性能。
4.3. Getting a Bit: Instructions per Operation
4.3.获得一个比特:每个操作的指令
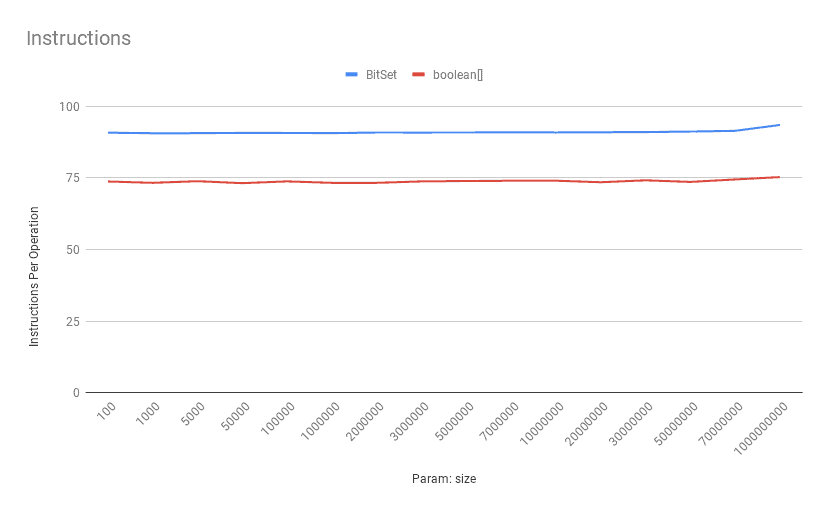
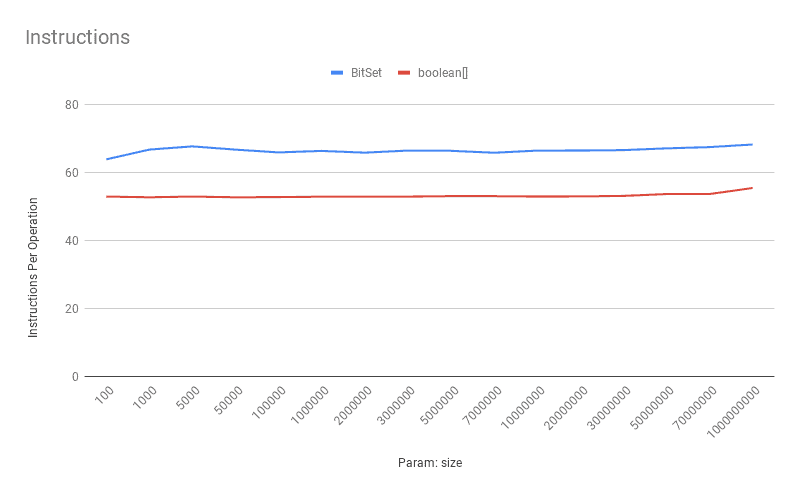
As we expected, the get operation on a boolean[] has fewer instructions per operation:
正如我们所期望的,对boolean[]的get操作每次操作的指令较少。
4.4. Getting a Bit: Data Cache Misses
4.4.获得一个比特:数据缓存丢失
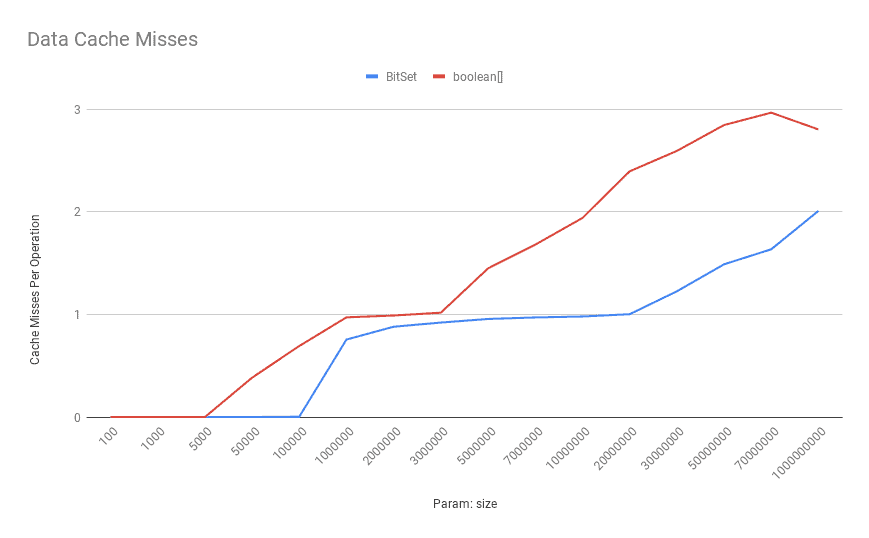
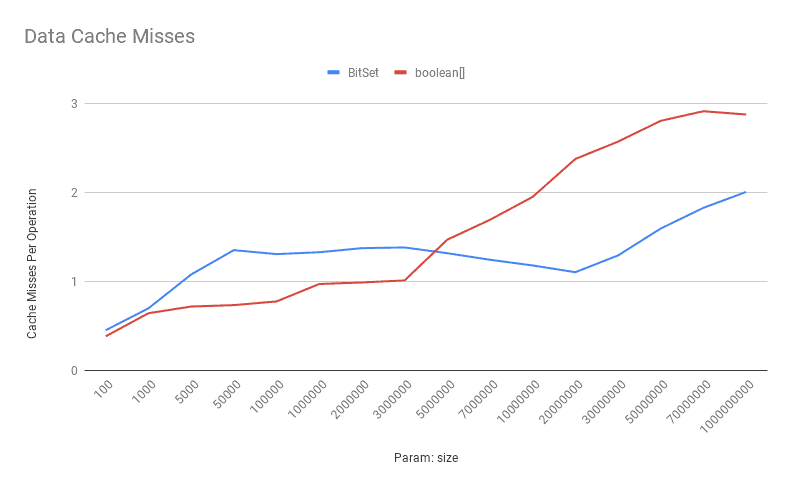
Now, let’s see how data cache misses are looking for these bit-vectors:
现在,让我们看看数据缓存缺失是如何寻找这些位向量的。
As shown above, the number of data cache misses for the boolean[] increases as the number of bits goes up.
如上所示,boolean[]的数据缓存错过次数随着比特数的增加而增加。
So cache misses are much more expensive than executing more instructions here. Therefore, the BitSet API outperforms the boolean[] in this scenario most of the time.
所以缓存缺失比在这里执行更多指令要昂贵得多。因此,在大多数情况下,BitSet API的性能优于boolean[] 在这种情况下。
4.5. Setting a Bit
4.5.设置一个位
To compare the throughput of set operations, we’re going to use these benchmarks:
为了比较集合操作的吞吐量,我们将使用这些基准测试。
@Benchmark
public void setBoolArray() {
    int index = ThreadLocalRandom.current().nextInt(size);
    array[index] = true;
}

@Benchmark
public void setBitSet() {
    int index = ThreadLocalRandom.current().nextInt(size);
    bitSet.set(index);
}
Basically, we’re picking a random bit index and set it to true. Similarly, we can run these benchmarks using the following command:
基本上,我们正在挑选一个随机的比特索引并将其设置为true。同样地,我们可以使用以下命令来运行这些基准。
$ java -jar jmh-1.0-SNAPSHOT.jar -f2 -t4 -prof perfnorm -rff set.csv setBitSet setBoolArrayLet’s see how the benchmark results look like for these operations in terms of throughput:
让我们看看这些操作在吞吐量方面的基准结果是怎样的。
This time the boolean[] outperforms the BitSet most of the time except for the very large sizes. Since we can have more BitSet bits inside a cache line, the effect of cache misses and false sharing can be more significant in BitSet instances.
这次boolean[] 在大多数情况下都优于BitSet ,除非是非常大的尺寸。由于我们可以在一个缓存行内拥有更多的BitSet位,所以在BitSet的情况下,缓存缺失和虚假共享的影响会更加明显。
Here is the data cache miss comparison:
下面是数据缓冲区的失误比较。
As shown above, the data cache misses for boolean[] is pretty low for low to a moderate number of bits. Again, when the number of bits increases, the boolean[] encounters more cache misses.
如上所示,boolean[] 的数据缓存失误在低至中等位数时相当低。同样,当比特数增加时,boolean[] 会遇到更多的缓存缺失。
Similarly, the instructions per operation for boolean[] is reasonably less than the BitSet:
同样地,boolean[] 的每条操作指令合理地少于BitSet。
4.6. Cardinality
4.6.心数
One of the other common operations in such bit-vectors is to count the number of set-bits. This time we’re going to run these benchmarks:
在这种位向量中,还有一个常见的操作是计算设置位的数量。这一次,我们要运行这些基准。
@Benchmark
public int cardinalityBoolArray() {
    int sum = 0;
    for (boolean b : array) {
        if (b) sum++;
    }

    return sum;
}

@Benchmark
public int cardinalityBitSet() {
    return bitSet.cardinality();
}
Again we can run these benchmarks with the following command:
同样,我们可以用以下命令运行这些基准。
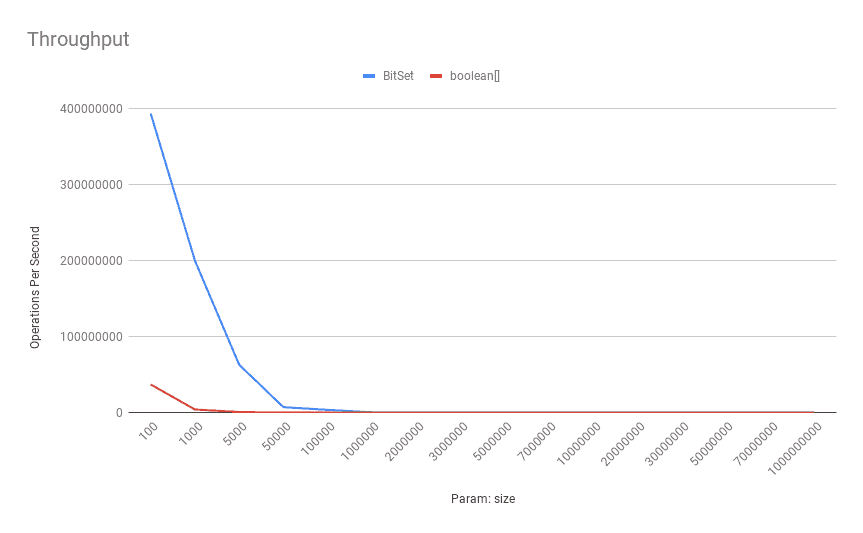
$ java -jar jmh-1.0-SNAPSHOT.jar -f2 -t4 -prof perfnorm -rff cardinal.csv cardinalityBitSet cardinalityBoolArrayHere’s what the throughput looks like for these benchmarks:
下面是这些基准测试的吞吐量情况。
In terms of cardinality throughput, the BitSet API outperforms the boolean[] almost all the time because it has much fewer iterations. To be more specific, the BitSet only has to iterate its internal long[] which has much less number of elements compared to the corresponding boolean[].
在cardinality吞吐量方面,BitSet API几乎一直优于boolean[] ,因为它的迭代次数少得多。更具体地说,BitSet 只需迭代其内部的long[] ,与相应的boolean[]相比,其元素数量要少得多。
Also, because of this line and random distribution of set-bits in our bit-vectors:
同时,由于我们的位向量中的集位的这种行和随机分布。
if (b) {
    sum++;
}
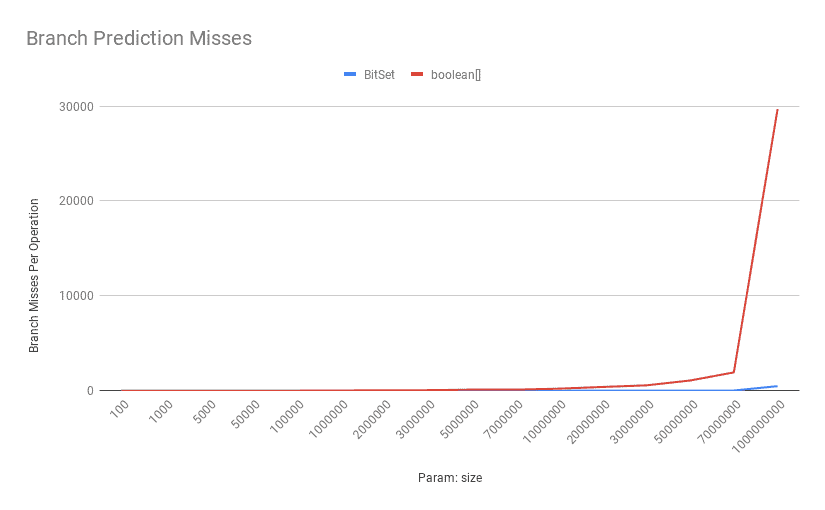
The cost of branch misprediction can be decisive, too:
branch错误预测的成本也可能是决定性的。
As shown above, as the number of bits increases, the number of mispredictions for the boolean[] goes up significantly.
如上所示,随着比特数的增加,boolean[] 的错误预测数量明显上升。
5. Conclusion
5.总结
In this article, we compared the throughput of BitSet and boolean[] in terms of three common operations: getting a bit, setting a bit, and calculating cardinality. In addition to throughput, we saw that the BitSet uses much less memory compared to a boolean[] with the same size.
在这篇文章中,我们比较了BitSet 和boolean[]在三个常见操作方面的吞吐量:获取一个位、设置一个位和计算cardinality。除了吞吐量之外,我们还看到,与具有相同大小的boolean[]相比,BitSet使用的内存要少得多。
To recap, in single-bit read-heavy scenarios, the boolean[] outperforms the BitSet in smaller sizes. However, when the number of bits increases, the BitSet has superior throughput.
简而言之,在单比特的重读场景中,boolean[]在较小的尺寸中优于BitSet。然而,当比特数增加时,BitSet的吞吐量更胜一筹。
Moreover, in single-bit write-heavy scenarios, the boolean[] exhibits a superior throughput almost all the time except for a very large number of bits. Also, in the batch read scenarios, the BitSet API completely dominates the boolean[] approach.
此外,在单比特写入量大的场景中,boolean[] 几乎一直表现出卓越的吞吐量,除非有非常多的比特。另外,在批量读取场景中,BitSetAPI完全支配了boolean[] 方法。
We used the JMH-perf integration to capture low-level CPU metrics such as L1 Data Cache Misses or Missed Branch Predictions. As of Linux 2.6.31, perf is the standard Linux profiler capable of exposing useful Performance Monitoring Counters or PMCs. It’s also possible to use this tool separately. To see some examples of this standalone usage, it’s highly recommended to read Branden Greg‘s blog.
我们使用 JMH-perf 集成来捕获低级别的 CPU 指标,例如 L1 数据缓存丢失或分支预测丢失。从Linux 2.6.31开始,perf是标准的Linux剖析器,能够暴露有用的Performance Monitoring Counters或PMCs。它也可以单独使用这个工具。要看到这种独立使用的一些例子,强烈建议阅读Branden Greg的博客。
As usual, all the examples are available over on GitHub. Moreover, the CSV results of all conducted benchmarks are also accessible on GitHub.
