1. Introduction
1.绪论
Applications sometimes hang up or run slowly, and identifying the root cause is not always a simple task. A thread dump provides a snapshot of the current state of a running Java process. However, the generated data includes multiple long files. Thus, we’ll need to analyze Java thread dumps and dig for the issue in a big chunk of unrelated information.
应用程序有时会挂起或运行缓慢,而确定其根本原因并不总是一件简单的事情。A thread dump 提供了一个正在运行的Java进程的当前状态的快照。然而,生成的数据包括多个长文件。因此,我们需要分析Java线程转储,在一大块不相关的信息中挖掘出问题。
In this tutorial, we’ll see how to filter out that data to efficiently diagnose performance issues. Also, we’ll learn to detect bottlenecks or even simple bugs.
在本教程中,我们将看到如何过滤掉这些数据以有效地诊断性能问题。此外,我们还将学习如何检测瓶颈,甚至是简单的bug。
2. Threads in the JVM
2.JVM中的线程
The JVM uses threads to execute every internal and external operation. As we know, the garbage collection process has its own thread, but also the tasks inside a Java application create their own.
JVM使用线程来执行每个内部和外部操作。正如我们所知,垃圾收集过程有自己的线程,但在Java应用程序内部的任务也会创建自己的线程。
During its lifetime, the thread goes through a variety of states. Each thread has an execution stack tracking the current operation. Besides, the JVM also stores all the previous methods successfully called. Therefore, it is possible to analyze the complete stack to study what happened with the application when things go wrong.
在其生命周期内,线程会经历各种状态。每个线程都有一个跟踪当前操作的执行栈。此外,JVM还存储了之前成功调用的所有方法。因此,有可能分析完整的堆栈,以研究当事情出错时应用程序发生了什么。
To showcase the topic of this tutorial, we’ll use as an example a simple Sender-Receiver application (NetworkDriver). The Java program sends and receives data packets so we’ll be able to analyze what is happening behind the scenes.
为了展示本教程的主题,我们将使用一个简单的Sender-Receiver应用程序(NetworkDriver)作为例子。Java程序发送和接收数据包,这样我们就能分析幕后发生了什么。
2.1. Capturing the Java Thread Dump
2.1.捕获Java线程数据包
Once the application is running, there are multiple ways to generate a Java thread dump for diagnostics. In this tutorial, we’ll use two utilities included in JDK7+ installations. Firstly, we’ll execute JVM Process Status (jps) command to discover the PID process of our application:
一旦应用程序运行,有多种方法可以生成Java线程转储以进行诊断。在本教程中,我们将使用 JDK7+ 安装中包含的两个实用程序。首先,我们将执行JVM Process Status (jps)命令来发现我们应用程序的PID进程。
$ jps
80661 NetworkDriver
33751 Launcher
80665 Jps
80664 Launcher
57113 Application
Secondly, we get the PID for our application, in this case, the one next to the NetworkDriver. Then, we’ll capture the thread dump using jstack. Finally, we’ll store the result in a text file:
其次,我们得到我们的应用程序的PID,在这种情况下,就是NetworkDriver旁边的那个。然后,我们将使用jstack捕获线程转储。最后,我们将把结果存储在一个文本文件中。
$ jstack -l 80661 > sender-receiver-thread-dump.txt2.2. Structure of a Sample Dump
2.2.倾倒样本的结构
Let’s have a look at the generated thread dump. The first line displays the timestamp while the second line informs about the JVM:
让我们看一下生成的线程转储。第一行显示的是时间戳,第二行则是关于JVM的信息。
2021-01-04 12:59:29
Full thread dump OpenJDK 64-Bit Server VM (15.0.1+9-18 mixed mode, sharing):
Next section shows the Safe Memory Reclamation (SMR) and non-JVM internal threads:
下一节展示了安全内存回收(SMR)和非JVM内部线程。
Threads class SMR info:
_java_thread_list=0x00007fd7a7a12cd0, length=13, elements={
0x00007fd7aa808200, 0x00007fd7a7012c00, 0x00007fd7aa809800, 0x00007fd7a6009200,
0x00007fd7ac008200, 0x00007fd7a6830c00, 0x00007fd7ab00a400, 0x00007fd7aa847800,
0x00007fd7a6896200, 0x00007fd7a60c6800, 0x00007fd7a8858c00, 0x00007fd7ad054c00,
0x00007fd7a7018800
}
Then, the dump displays the list of threads. Each thread contains the following information:
然后,转储显示线程的列表。每个线程都包含以下信息。
- Name: it can provide useful information if developers include a meaningful thread name
- Priority (prior): the priority of the thread
- Java ID (tid): the unique ID given by the JVM
- Native ID (nid): the unique ID given by the OS, useful to extract correlation with CPU or memory processing
- State: the actual state of the thread
- Stack trace: the most important source of information to decipher what is happening with our application
We can see from top to bottom what the different threads are doing at the time of the snapshot. Let’s focus only on the interesting bits of the stack waiting to consume the message:
我们可以从上到下看到不同的线程在快照时正在做什么。让我们只关注堆栈中等待消费消息的有趣部分。
"Monitor Ctrl-Break" #12 daemon prio=5 os_prio=31 cpu=17.42ms elapsed=11.42s tid=0x00007fd7a6896200 nid=0x6603 runnable  [0x000070000dcc5000]
   java.lang.Thread.State: RUNNABLE
	at sun.nio.ch.SocketDispatcher.read0(java.base@15.0.1/Native Method)
	at sun.nio.ch.SocketDispatcher.read(java.base@15.0.1/SocketDispatcher.java:47)
	at sun.nio.ch.NioSocketImpl.tryRead(java.base@15.0.1/NioSocketImpl.java:261)
	at sun.nio.ch.NioSocketImpl.implRead(java.base@15.0.1/NioSocketImpl.java:312)
	at sun.nio.ch.NioSocketImpl.read(java.base@15.0.1/NioSocketImpl.java:350)
	at sun.nio.ch.NioSocketImpl$1.read(java.base@15.0.1/NioSocketImpl.java:803)
	at java.net.Socket$SocketInputStream.read(java.base@15.0.1/Socket.java:981)
	at sun.nio.cs.StreamDecoder.readBytes(java.base@15.0.1/StreamDecoder.java:297)
	at sun.nio.cs.StreamDecoder.implRead(java.base@15.0.1/StreamDecoder.java:339)
	at sun.nio.cs.StreamDecoder.read(java.base@15.0.1/StreamDecoder.java:188)
	- locked <0x000000070fc949b0> (a java.io.InputStreamReader)
	at java.io.InputStreamReader.read(java.base@15.0.1/InputStreamReader.java:181)
	at java.io.BufferedReader.fill(java.base@15.0.1/BufferedReader.java:161)
	at java.io.BufferedReader.readLine(java.base@15.0.1/BufferedReader.java:326)
	- locked <0x000000070fc949b0> (a java.io.InputStreamReader)
	at java.io.BufferedReader.readLine(java.base@15.0.1/BufferedReader.java:392)
	at com.intellij.rt.execution.application.AppMainV2$1.run(AppMainV2.java:61)

   Locked ownable synchronizers:
	- <0x000000070fc8a668> (a java.util.concurrent.locks.ReentrantLock$NonfairSync)
At a first glance, we see that the main stack trace is executing java.io.BufferedReader.readLine which is the expected behavior. If we look further down we’ll see all the JVM methods executed by our application behind the scenes. Therefore, we are able to identify the root of the problem by looking at the source code or other internal JVM processing.
乍一看,我们看到主堆栈跟踪正在执行java.io.BufferedReader.readLine,这是预期行为。如果我们再往下看,我们会看到所有由我们的应用程序在幕后执行的JVM方法。因此,我们能够通过查看源代码或其他JVM内部处理来确定问题的根源。
At the end of the dump, we’ll notice there are several additional threads performing background operations such as Garbage Collection (GC) or object termination:
在转储结束时,我们会注意到有几个额外的线程在执行后台操作,如垃圾收集(GC)或对象终止。
"VM Thread" os_prio=31 cpu=1.85ms elapsed=11.50s tid=0x00007fd7a7a0c170 nid=0x3603 runnable
"GC Thread#0" os_prio=31 cpu=0.21ms elapsed=11.51s tid=0x00007fd7a5d12990 nid=0x4d03 runnable
"G1 Main Marker" os_prio=31 cpu=0.06ms elapsed=11.51s tid=0x00007fd7a7a04a90 nid=0x3103 runnable
"G1 Conc#0" os_prio=31 cpu=0.05ms elapsed=11.51s tid=0x00007fd7a5c10040 nid=0x3303 runnable
"G1 Refine#0" os_prio=31 cpu=0.06ms elapsed=11.50s tid=0x00007fd7a5c2d080 nid=0x3403 runnable
"G1 Young RemSet Sampling" os_prio=31 cpu=1.23ms elapsed=11.50s tid=0x00007fd7a9804220 nid=0x4603 runnable
"VM Periodic Task Thread" os_prio=31 cpu=5.82ms elapsed=11.42s tid=0x00007fd7a5c35fd0 nid=0x9903 waiting on condition
Finally, the dump displays the Java Native Interface (JNI) references. We should pay special attention to this when memory leak occurs because they aren’t automatically garbage collected:
最后,转储显示了Java Native Interface(JNI)的引用。当内存泄漏发生时,我们应该特别注意这一点,因为它们不会被自动垃圾收集。
JNI global refs: 15, weak refs: 0Thread dumps are fairly similar in their structure, but we’ll want to get rid of the non-important data generated for our use case. On the other hand, we’ll need to keep and group the important information from the tons of logs produced by the stack trace. Let’s see how to do it!
线程转储的结构相当类似,但我们要摆脱为我们的用例产生的非重要数据。另一方面,我们需要从堆栈跟踪产生的大量日志中保留并分组重要信息。让我们看看如何做到这一点!
3. Recommendations to Analyze a Thread Dump
3.分析线程转储的建议
In order to understand what is happening with our application, we’ll need to efficiently analyze the generated snapshot. We’ll have a lot of information with precise data of all the threads at the time of the dump. However, we’ll need to curate the log files, making some filtering and grouping to extract useful hints from the stack trace. Once we prepared the dump we’ll be able to analyze the problem using different tools. Let’s see how to decipher the content of a sample dump.
为了了解我们的应用程序正在发生什么,我们需要有效地分析生成的快照。我们将拥有大量的信息在转储时所有线程的精确数据。然而,我们需要对日志文件进行整理,进行一些过滤和分组,以便从堆栈跟踪中提取有用的提示。一旦我们准备好转储,我们就可以使用不同的工具来分析问题。让我们看看如何破译样本转储的内容。
3.1. Synchronization Issues
3.1.同步问题
One interesting tip to filter out the stack trace is the state of the thread. We’ll mainly focus on RUNNABLE or BLOCKED threads and eventually TIMED_WAITING ones. Those states will point us in the direction of a conflict between two or more threads:
过滤掉堆栈跟踪的一个有趣的提示是线程的状态。我们主要关注RUNNABLE或BLOCKED线程,最后是TIMED_WAITING的线程。这些状态将为我们指出两个或多个线程之间的冲突方向。
- In a deadlock situation in which several threads running hold a synchronized block on a shared object
- In thread contention, when a thread is blocked waiting for others to finish. For example, the dump generated in the previous section
3.2. Execution Issues
3.2.执行问题
As a rule of thumb, for abnormally high CPU usage we only need to look at RUNNABLE threads. We’ll use thread dumps together with other commands to acquire extra information. One of these commands is top -H -p PID, which displays what threads are consuming the OS resources within that particular process. We also need to look at the internal JVM threads such as GC just in case. On the other hand, when the processing performance is abnormally low, we’ll look at BLOCKED threads.
根据经验,对于异常的高CPU使用率,我们只需要查看RUNNABLE线程。我们将使用线程转储和其他命令来获取额外的信息。其中一个命令是top -H -p PID,它显示在该特定进程中哪些线程正在消耗操作系统资源。我们还需要查看JVM的内部线程,比如GC,以防万一。另一方面,当处理性能异常低下时,我们将查看BLOCKED线程。
In those cases, a single dump will most surely not be enough to understand what is happening. We’ll need a number of dumps at close intervals in order to compare the stacks of the same threads at different times. On the one hand, one snapshot is not always enough to find out the root of the problem. On the other hand, we need to avoid noise between snapshots (too much information).
在这些情况下,单个转储肯定不足以了解正在发生的事情。我们需要一些转储 在接近的时间间隔,以便比较同一线程在不同时期的堆栈。一方面,一个快照并不总是足以找出问题的根源。另一方面,我们需要避免快照之间的噪音(太多的信息)。
To understand the threads’ evolution over time, a recommended best practice is to take at least 3 dumps, one at every 10 seconds. Another useful tip is to split the dumps into small chunks to avoid crashes loading the files.
为了了解线程随时间的演变,推荐的最佳做法是至少3个转储,每10秒一个。另一个有用的提示是将转储分成小块,以避免加载文件时出现崩溃。
3.3. Recommendations
3.3.建议
In order to efficiently decipher the root of the problem, we’ll need to organize the huge amount of information in the stack trace. Therefore, we’ll take into consideration the following recommendations:
为了有效地破译问题的根源,我们将需要组织堆栈跟踪中的大量信息。因此,我们要考虑到以下建议。
- In execution issues, capture several snapshots with an interval of 10 seconds will help to focus on the actual problems. It is also recommended to split the files if needed to avoid loading crashes
- Use naming when creating new threads to better identify your source code
- Depending on the issue, ignore internal JVM processing (for instance GC)
- Focus on long-running or blocked threads when issuing abnormal CPU or memory usage
- Correlate the thread’s stack with CPU processing by using top -H -p PID
- And most importantly, use Analyzer tools
Analyzing the Java thread dumps manually could be a tedious activity. For simple applications, it is possible to identify the threads generating the problem. On the other hand, for complex situations, we’ll need tools to ease this task. We’ll showcase how to use the tools in the next sections, using the dump generated for the sample thread contention.
手动分析Java线程转储可能是一项乏味的活动。对于简单的应用程序,有可能确定产生问题的线程。另一方面,对于复杂的情况,我们需要工具来缓解这项任务。我们将在接下来的章节中展示如何使用这些工具,使用为样本线程争论产生的转储。
4. Online Tools
4.在线工具
There are several online tools available. When using this kind of software we need to take into account security issues. Remember that we could be sharing the logs with third-party entities.
有几种在线工具可供选择。在使用这类软件时,我们需要考虑到安全问题。记住,我们可能会与第三方实体分享日志。
4.1. FastThread
4.1.快速线程
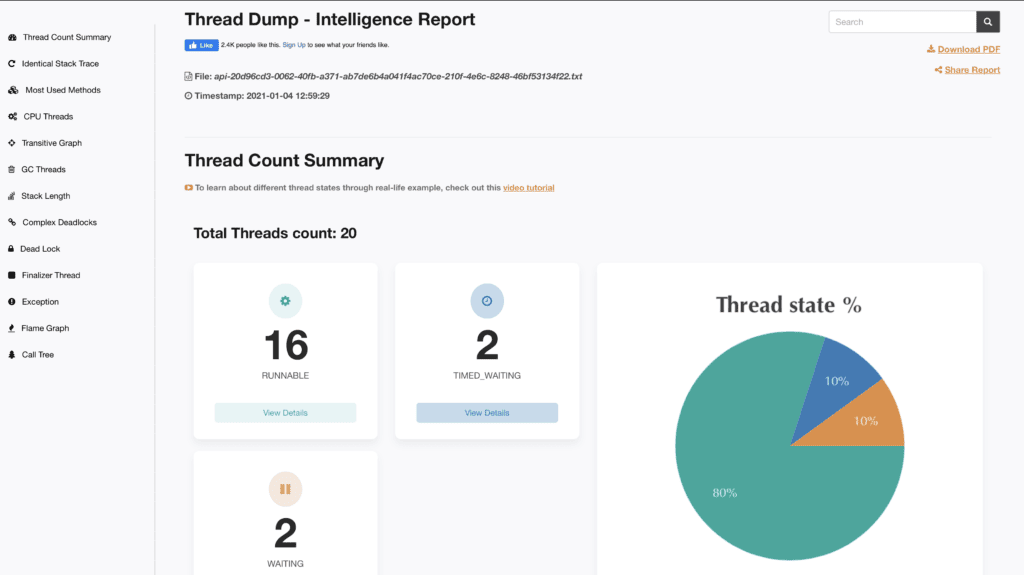
FastThread is probably the best online tool to analyze thread dumps for production environments. It provides a very nice graphical user interface. It also includes multiple functionalities such as CPU usage by threads, stack length, and most used and complex methods:
FastThread可能是分析生产环境的线程转储的最佳在线工具。它提供了一个非常漂亮的图形化用户界面。它还包括多种功能,如线程的CPU使用率、堆栈长度以及最常用和最复杂的方法。
FastThread incorporates a REST API feature to automate the analysis of the thread dumps. With a simple cURL command, it’s possible to instantly send the results. The main drawback is security because it stores the stack trace in the cloud.
FastThread包含了一个REST API功能,可以自动分析线程转储的情况。通过一个简单的cURL命令,就可以立即发送结果。主要的缺点是安全,因为它将堆栈跟踪存储在云中。
4.2. JStack Review
4.2.JStack评论
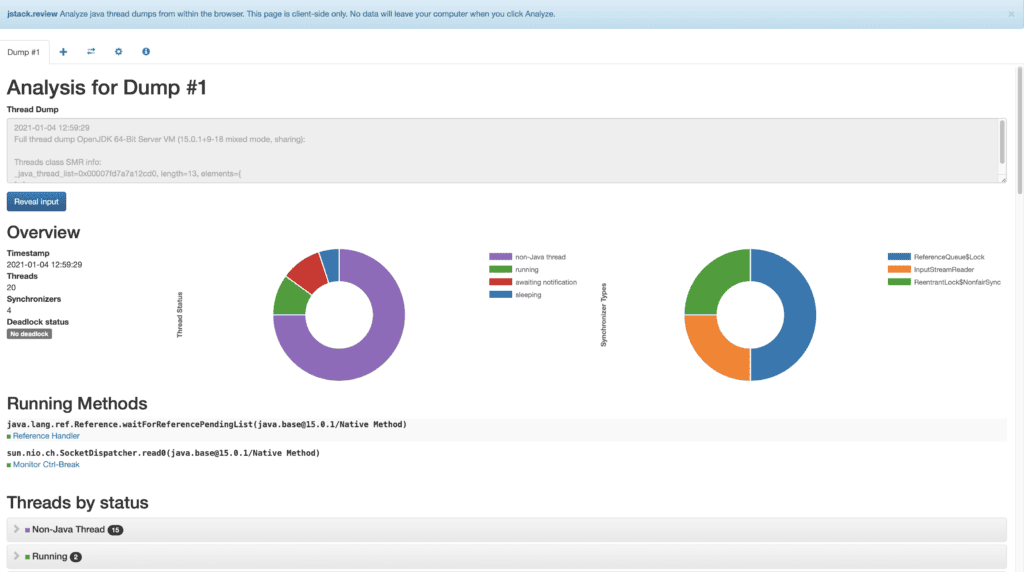
JStack Review is an online tool that analyzes the dumps within the browser. It is client-side only, thus no data is stored outside your computer. From the security perspective, this is a major advantage to use it. It provides a graphical overview of all the threads, displaying the running methods but also grouping them by status. JStack Review separates threads producing stack from the rest which is very important to ignore, for instance, internal processes. Finally, it also includes the synchronizers and the ignored lines:
JStack Review是一个在线工具,可以在浏览器中分析转储。它只是客户端,因此没有数据存储在您的计算机之外。从安全角度来看,这是使用它的一个主要优势。它提供了一个所有线程的图形概览,显示运行的方法,但也按状态分组。JStack Review将产生堆栈的线程与其他线程分开,这对于忽略内部进程等非常重要。最后,它还包括同步器和被忽略的行。
4.3. Spotify Online Java Thread Dump Analyzer
4.3.Spotify在线Java线程转储分析器
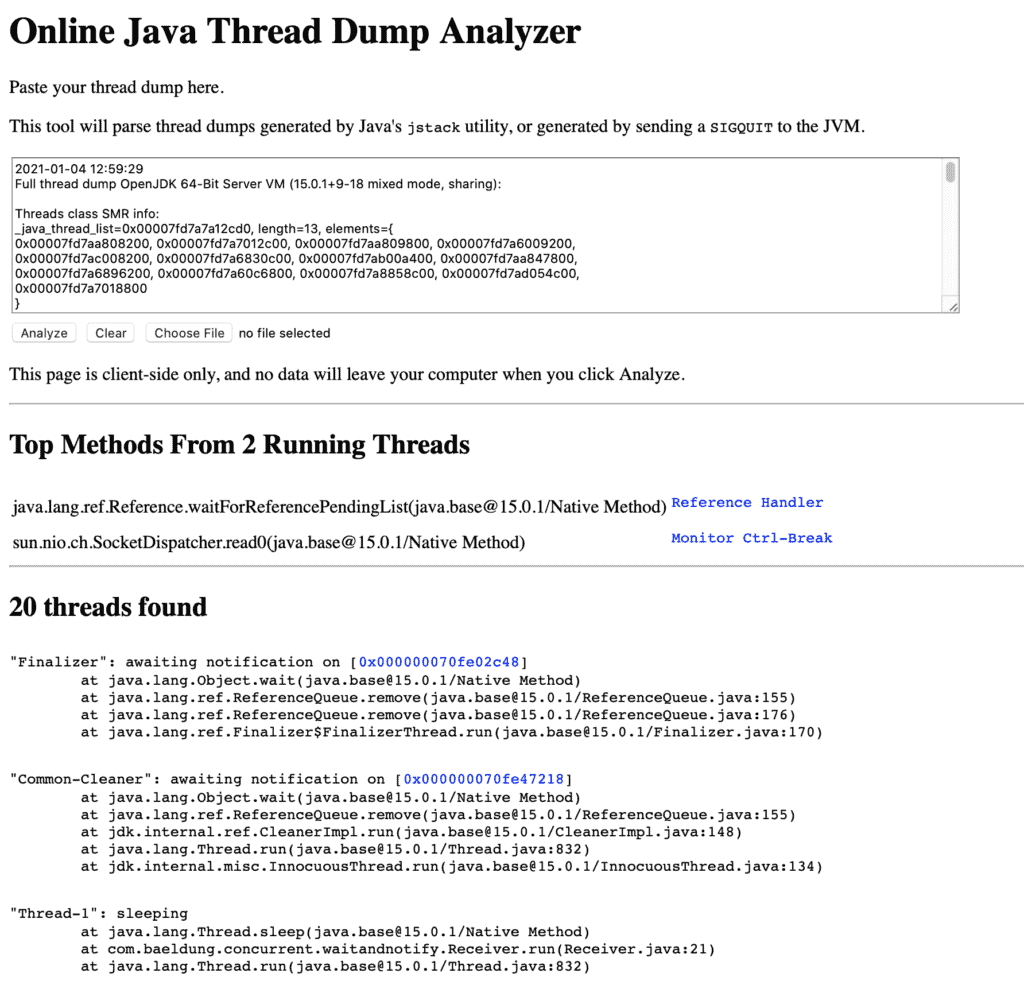
Spotify Online Java Thread Dump Analyser is an online open-source tool written in JavaScript. It shows the results in plain text separating the threads with and without the stack. It also displays the top methods from the running threads:
Spotify Online Java Thread Dump Analyser是一个用JavaScript编写的在线开源工具。它以纯文本的形式显示结果,将有堆栈和无堆栈的线程分开。它还可以显示运行中的线程的顶级方法。
5. Standalone Applications
5.独立的应用程序
There are also several standalone applications that we can use locally.
还有几个独立的应用程序,我们可以在本地使用。
5.1. JProfiler
5.1.JProfiler
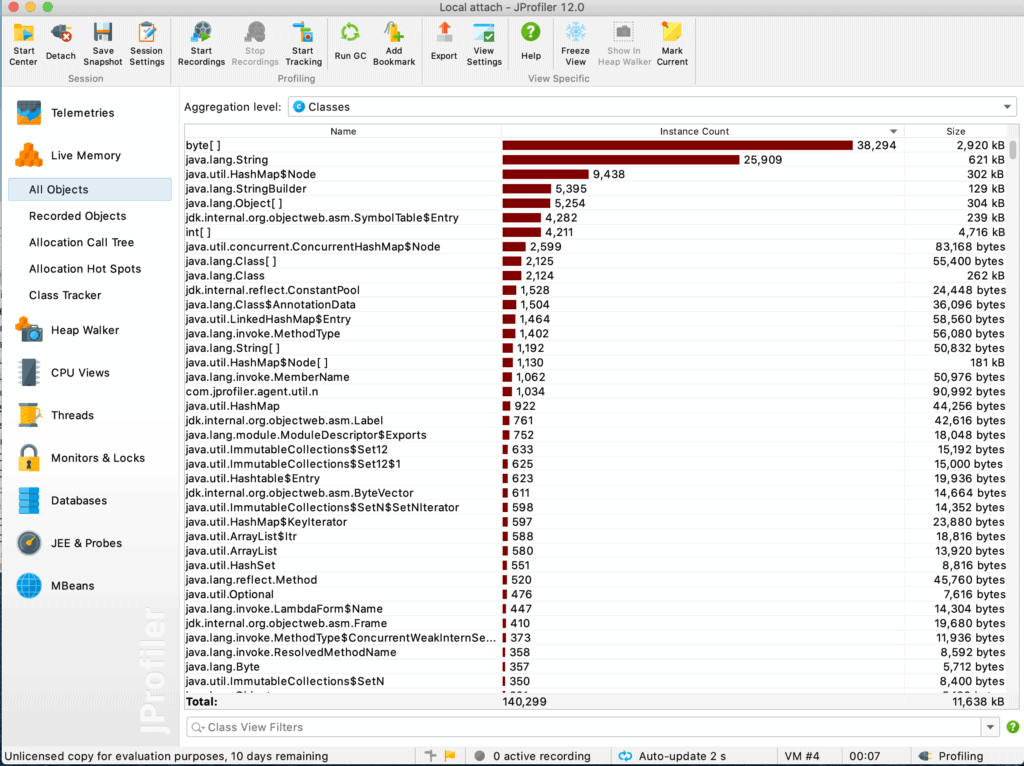
JProfiler is the most powerful tool in the market, and well-known among the Java developer community. It is possible to test the functionality with a 10-day trial license. JProfiler allows the creation of profiles and attaches running applications to them. It includes multiple functionalities to identify problems on the spot, such as CPU and memory usage and database analysis. It supports also integration with IDEs:
JProfiler是市场上最强大的工具,在Java开发者社区中享有盛名。可以通过10天的试用许可来测试其功能。JProfiler 允许创建配置文件并将正在运行的应用程序附加到这些配置文件中。它包括多种功能,可以当场发现问题,如CPU和内存的使用以及数据库分析。它还支持与IDE的整合。
5.2. IBM Thread Monitor and Dump Analyzer for Java (TMDA)
5.2.IBM Java线程监控和转储分析器(TMDA)
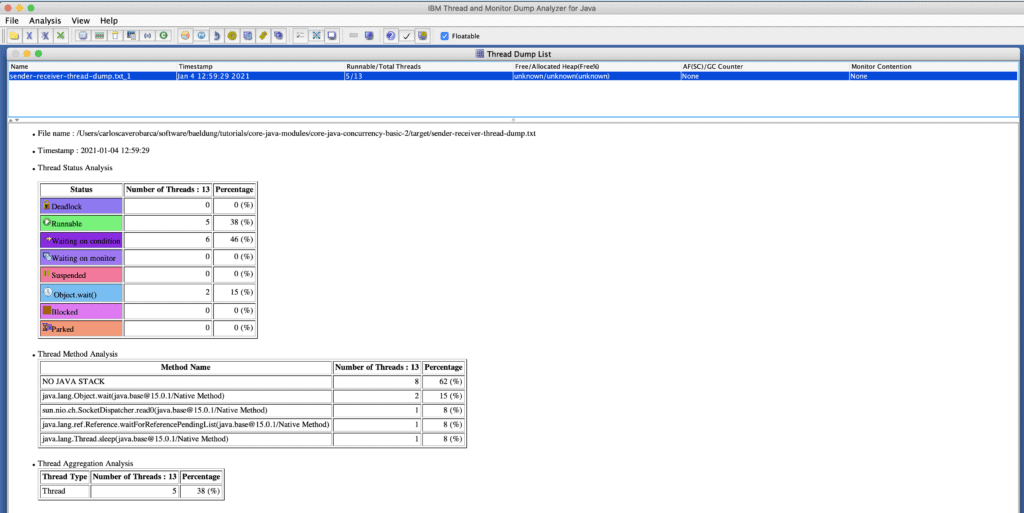
IBM TMDA can be used to identify thread contention, deadlocks, and bottlenecks. It is freely distributed and maintained but it does not offer any guarantee or support from IBM:
IBM TMDA可用于识别线程争用、死锁和瓶颈。它是免费发布和维护的,但它并不提供来自IBM的任何保证或支持。
5.3. Irockel Thread Dump Analyser (TDA)
5.3.Irockel线程转储分析器(TDA)
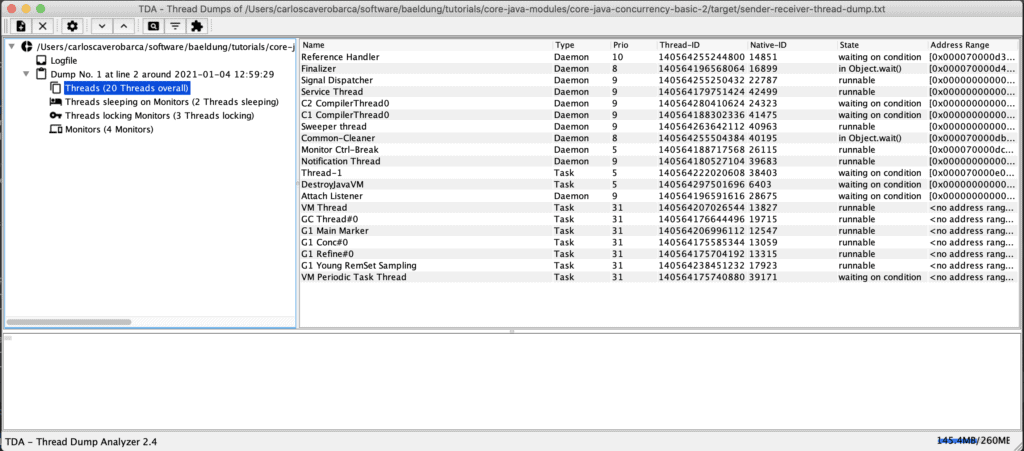
Irockel TDA is a standalone open-source tool licensed with LGPL v2.1. The last version (v2.4) was released in August 2020 so it is well maintained. It displays the thread dump as a tree providing also some statistics to ease the navigation:
Irockel TDA是一个独立的开源工具,采用LGPL v2.1许可。最后一个版本(v2.4)是在2020年8月发布的,所以它得到了很好的维护。它以树状方式显示线程转储,并提供一些统计数据以方便导航。
Finally, IDEs support basic analysis of thread dumps so it is possible to debug the application during development time.
最后,IDE支持对线程转储的基本分析,因此有可能在开发时间内对应用程序进行调试。
5. Conclusion
5.总结
In this article, we demonstrated how Java thread dump analysis can help us pinpoint synchronization or execution issues.
在这篇文章中,我们演示了Java线程转储分析如何帮助我们找出同步或执行问题。
Most importantly, we reviewed how to analyze them properly including recommendations to organize the enormous amount of information embedded in the snapshot.
最重要的是,我们审查了如何正确分析它们,包括组织快照中所包含的大量信息的建议。
