1. Introduction
1.介绍
In this article, we’re going to explore Lightrun – a Developer Observability platform – by introducing it into an application and showing what we can achieve with it.
在本文中,我们将探索Lightrun–一个开发者可观察性平台–将其引入一个应用程序,并展示我们可以利用它实现的目标。
2. What Is Lightrun?
2.什么是Lightrun?
Lightrun is an observability platform that allows us to instrument our Java (other languages are also supported) applications and then view the instrumentation directly from within IntelliJ, Visual Studio Code, and many other logging platforms and APMs. It’s designed to be able to seamlessly add instrumentation to applications running in any environment and access them from anywhere, allowing us to quickly diagnose issues anywhere from our local workstation all the way to production instances.
Lightrun是一个可观察性平台,它允许我们对Java(也支持其他语言)应用程序进行检测,然后直接从IntelliJ、Visual Studio Code以及其他许多日志平台和APM中查看检测结果。它被设计为能够将检测结果无缝添加到在任何环境中运行的应用程序,并从任何地方访问它们,使我们能够快速诊断从本地工作站一直到生产实例等任何地方的问题。
Lightrun works with two different components that integrate together:
Lightrun的工作原理是将两个不同的组件整合在一起。
- The Lightrun Agent runs as part of the application and instruments telemetry as requested. In Java applications, this works as a Java Agent. We’ll run this agent as part of every application that we want to use Lightrun with.
- The Lightrun Plugin runs as part of our development environment and allows us to communicate with the agents. This is our means to see what is running, add new instrumentation to an application and receive the results of this instrumentation.
Once all of this is set up, we can then manage three different types of instrumentation:
一旦所有这些都设置好了,我们就可以管理三种不同类型的仪器。
- Logs – These are the ability to add arbitrary log statements into the running application at any point, logging out any available values (including complex expressions). These logs can be sent either to the standard output, back to the Lightrun plugin in our development environment, or both at the same time. In addition, they can be invoked conditionally – for example, based on a specific user or session ID pre-defined in the code.
- Snapshots – These allow us to capture a live snapshot of the application at any point. This will record the details of exactly when and where the snapshot was triggered, the value of all variables, and the complete call stack to this point. These can also be invoked conditionally, much like Logs.
- Metrics – These allow us to record metrics similar to what can be generated by Micrometer, allowing us to count the number of times a line of code is executed, record timings for a block of code, or any other numerical calculation we might want.
All of these things can be done easily in our code already. What Lightrun gives us here is the ability to do these things in an already running application without needing to change or re-deploy the application. This means we can get targeted instrumentation in production with zero downtime.
所有这些事情都可以在我们的代码中轻松完成。Lightrun为我们提供的是在已经运行的应用程序中完成这些工作的能力,而不需要改变或重新部署应用程序。这意味着我们可以在生产中获得有针对性的仪器,而无需停机。
Furthermore, all these logs are ephemeral. They do not persist in the source code or running application and can be added and removed as needed.
此外,所有这些日志都是短暂的。它们不会在源代码或运行中的应用程序中持续存在,可以根据需要添加和删除。
3. Example Application
3.应用实例
For this article, we have an application that is already built and ready to work with. This application is designed for tracking tasks that are assigned to people and allows users to query this data. This code can be found on GitHub and will require Java 17+ and Maven 3.6 to build it correctly.
在这篇文章中,我们有一个已经建成并可以使用的应用程序。该应用程序旨在跟踪分配给人们的任务,并允许用户查询这些数据。这段代码可以在GitHub上找到,需要Java 17+和Maven 3.6才能正确构建。
This application is architected as three different services – one for managing users, another for managing tasks, and a third that orchestrates over the two of them. The tasks-service and users-services then have their own databases, and there is a JMS queue between the two – allowing for the users-service to indicate that a user was deleted so that the tasks-service can tidy things up.
这个应用程序被架构为三个不同的服务–一个用于管理用户,另一个用于管理任务,还有一个负责协调这两个服务的服务。任务服务和用户服务有各自的数据库,两者之间有一个JMS队列–允许用户服务指示一个用户被删除,以便任务服务可以整理事情。
These databases and the JMS queue are all embedded within the applications for convenience. However, in reality, this would naturally use real infrastructure.
为了方便,这些数据库和JMS队列都被嵌入到应用程序中。然而,在现实中,这自然会用到真正的基础设施。
3.1. Tasks Service
3.1.任务服务
In this article, we’re only interested in the tasks-service. However, in future articles, we’re going to explore all three of them and how they interact with each other.
在本文中,我们只对tasks-service感兴趣。然而,在未来的文章中,我们将探讨所有这三种服务以及它们之间的互动。
This service is a Spring Boot application built with Maven on Java 17. When running, this has HTTP endpoints for:
该服务是一个用Maven在Java 17上构建的Spring Boot应用程序。运行时,它的HTTP端点为:。
- GET / – Allows the client to search tasks, filtering by the user that created it and by the status of it.
- POST / – Allows the client to create a new task.
- GET /{id} – Allows the client to get a single task by ID.
- PATCH /{id} – Allows the client to update a task, changing the status and the user it’s assigned to.
- DELETE /{id} – Allows the client to delete a task.
We also have a JMS listener, which can indicate when a user was deleted from our users-service. In this case, we automatically delete all tasks created by that user and unassign all tasks assigned to that user.
我们也有一个JMS监听器,它可以指示当一个用户从我们的users-service中被删除。在这种情况下,我们会自动删除该用户创建的所有任务,并取消分配给该用户的所有任务。
We also have a couple of bugs in our application that we’ll be able to diagnose with the help of Lightrun.
我们的应用程序中也有几个错误,在Lightrun的帮助下,我们将能够诊断出这些错误。
4. Setting Up Lightrun
4.设置Lightrun
Before we start, we’ll need an account with Lightrun and to set it up locally. This can be done by visiting https://app.lightrun.com/ and following the instructions.
在我们开始之前,我们需要一个Lightrun的账户,并在本地进行设置。这可以通过访问https://app.lightrun.com/并按照说明进行操作。
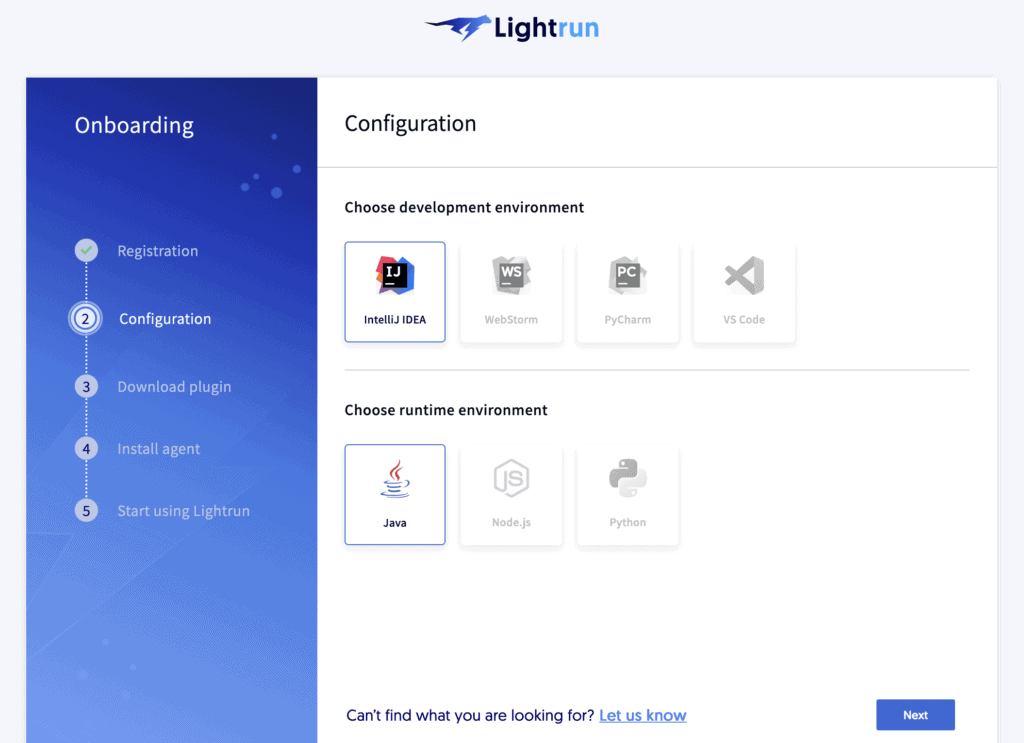
Once we have registered, we’ll need to select the development environment and programming language. For this article, we’ll be using IntelliJ and Java, so we’ll select those and move on:
一旦我们注册了,我们就需要选择开发环境和编程语言。在本文中,我们将使用IntelliJ和Java,所以我们将选择这些,然后继续前进。
We then get instructions for how to install the Lightrun plugin into our environment, so we can just follow these.
然后,我们得到了如何将Lightrun插件安装到我们的环境中的指示,所以我们可以直接按照这些指示来做。
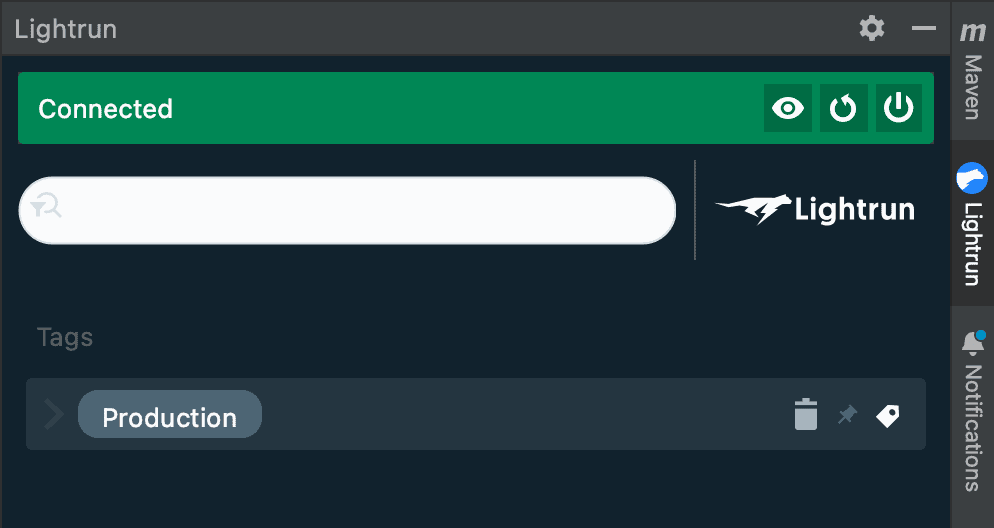
We also need to ensure that we sign in to our new account from our development environment, after which we’ll have access to our Lightrun agents – none yet – from within the editor:
我们还需要确保从我们的开发环境中登录到我们的新账户,之后我们就可以从编辑器中访问我们的Lightrun代理–还没有–。
Finally, we get instructions on how to download the Java agent that we’ll use to instrument our applications. These instructions are platform-specific, so we need to make sure we follow the ones that work for our exact setup.
最后,我们得到了关于如何下载Java代理的指示,我们将用它来检测我们的应用程序。这些说明是针对特定平台的,所以我们需要确保我们遵循适用于我们具体设置的说明。
Once we’ve done this, we can start our application with the agent installed. Make sure that the tasks-service is built, and then we can run it:
一旦我们完成了这些,我们就可以在安装了代理后启动我们的应用程序。确保tasks-service被构建,然后我们可以运行它。
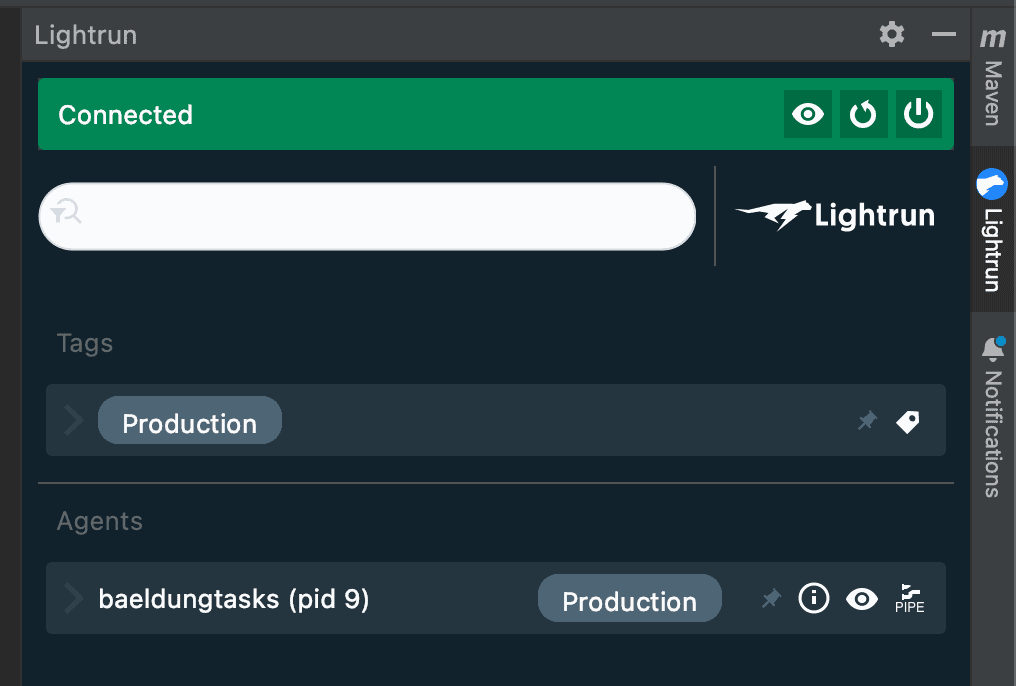
$ java -jar -agentpath:../agent/lightrun_agent.so target/tasks-service-0.0.1-SNAPSHOT.jarAt this point, the Onboarding screen in our web browser will allow us to progress, and the UI in our development environment will update automatically to show our application running:
在这一点上,我们的网络浏览器中的Onboarding屏幕将允许我们取得进展,而我们开发环境中的UI将自动更新,以显示我们的应用程序正在运行。
Note that these are all connected to our Lightrun account, so we can see them regardless of where the applications are running. This means we can use the exact same tooling on our applications running on our local machine, inside Docker containers, or any other environment that supports our runtime, regardless of where it is in the world.
注意,这些都与我们的Lightrun账户相连,因此无论应用程序在哪里运行,我们都可以看到它们。这意味着我们可以在本地机器、Docker容器内或任何其他支持我们运行时的环境中运行的应用程序上使用完全相同的工具,无论它在世界何处。
5. Capturing Snapshots
5 捕捉快照
One of the most powerful features of Lightrun is the ability to add snapshots to currently running applications. These will then allow us to capture the exact state of execution at a given point in our application. This can then give invaluable insights into exactly what is happening within our code. They can be thought of as “virtual breakpoints”, except that they don’t interrupt the flow of the program. Instead, they capture all of the information that you would be able to see from a breakpoint for us to look at later.
Lightrun 最强大的功能之一是能够向当前运行的应用程序添加snapshots。这将使我们能够捕捉到我们应用程序中某一点的确切执行状态。这将为我们了解代码中的确切情况提供宝贵的见解。它们可以被认为是 “虚拟断点”,只是它们不会中断程序的流程。相反,它们捕获了你能从断点中看到的所有信息,供我们以后查看。
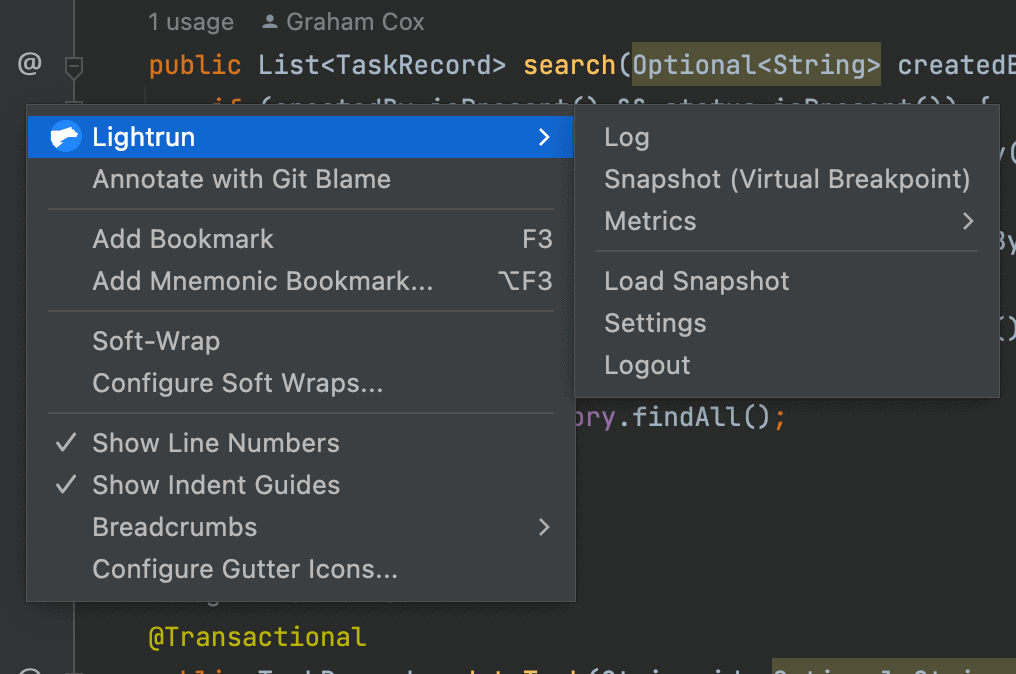
Snapshots – as well as Logs and Metrics – are added from within our development environment. We’ll typically do this by right-clicking on the line that we want to add the instrumentation and then selecting the “Lightrun” option.
快照–以及日志和指标–是在我们的开发环境中添加的。我们通常通过右键点击我们想要添加仪器的那一行,然后选择 “Lightrun “选项来完成。
Then we can add our instrumentation by selecting it from the subsequent menu:
然后我们可以从随后的菜单中选择添加我们的仪器设备。
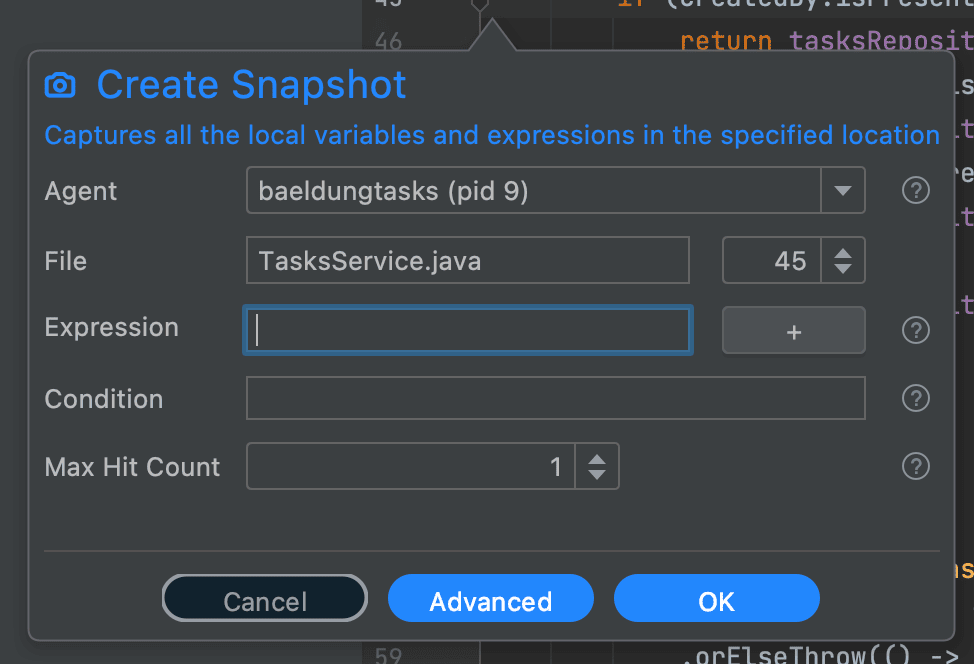
This will then open a panel allowing us to add the snapshot:
然后,这将打开一个面板,允许我们添加快照。
Here we need to select the agent that we want to instrument, and possibly specify other details about exactly how it will work.
在这里,我们需要选择我们想要使用的代理,并可能指定关于它如何工作的其他细节。
When we’re happy with everything, we then hit the Create button. This will then add a new Snapshot entry into our sidebar, and we’ll get a blue camera icon against the line of code.
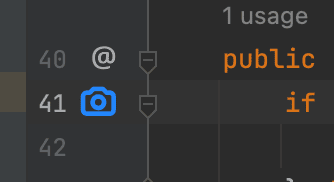
当我们对一切都满意时,我们再点击创建按钮。这将在我们的侧边栏中添加一个新的快照条目,我们会得到一个蓝色的相机图标,对着这行代码。
This then indicates that this line will capture a snapshot when executed:
这就表明这一行在执行时将捕获一个快照。
Note that if something goes wrong, the camera will be red instead. Typically, this would mean that the running code doesn’t correspond to the source code, though other reasons might exist and need to be explored here as well.
请注意,如果出了问题,摄像机就会变成红色。通常情况下,这意味着运行中的代码与源代码不一致,尽管可能存在其他原因,这里也需要探讨一下。
6. Diagnosing A Bug – Searching Tasks
6.诊断一个错误–搜索任务
Our tasks-service, unfortunately, has a bug where performing a filtered search of tasks never returns anything. If we perform an unfiltered search, then this will correctly return all tasks, but as soon as a filter is added – whether it’s createdBy, status, or both – then we suddenly get no results.
我们的任务服务,不幸的是,有一个错误,即执行过滤的任务搜索永远不会返回任何东西。如果我们执行未过滤的搜索,那么这将正确地返回所有任务,但只要添加一个过滤器 – 无论是createdBy,status,还是两者 – 然后我们突然得到任何结果。
For example, if we make a call to http://localhost:8082?status=PENDING then we should get some results, but instead, we always get an empty array.
例如,如果我们调用http://localhost:8082?status=PENDING,那么我们应该得到一些结果,但相反,我们总是得到一个空数组。
Our application is architected such that we have a TasksController to handle the incoming HTTP request. This then calls the TasksService to do the real work, and this works in terms of a TasksRepository.
我们的应用程序是这样架构的:我们有一个TasksController来处理传入的HTTP请求。然后调用TasksService来完成真正的工作,这在TasksRepository方面发挥作用。
This repository is a Spring Data interface meaning that we have no code in there directly that we can instrument. Instead, we’ll add a snapshot in the TasksService. In particular, we’ll add it on the very first line of the search() method. This will let us see the initial conditions that exist when the method is called, regardless of which code path we end up going through inside the method:
该资源库是一个Spring Data接口,这意味着我们在其中没有可以直接使用的代码。相反,我们将在TasksService中添加一个快照。特别是,我们将在search()方法的第一行添加它。这将让我们看到该方法被调用时存在的初始条件,无论我们最终在该方法中通过何种代码路径。
Having done this, we’ll then call our endpoint. Again, we’ll get the same result of an empty array.
做完这些后,我们再调用我们的端点。同样,我们会得到同样的结果:一个空数组。
However, this time we’ll capture a snapshot in our development environment – which we can see on the Snapshots tab:
然而,这一次我们将在我们的开发环境中捕获一个快照–我们可以在快照标签上看到。
This shows us the stack trace to where our snapshot was captured and the state of all visible variables at the time it was captured. Let’s focus on the variables here. Two of these are the parameters that were passed to the method, and the third is this. The parameters are the ones that are potentially most interesting, so we’ll look at those.
这向我们展示了捕捉快照的堆栈跟踪,以及捕捉快照时所有可见变量的状态。让我们关注一下这里的变量。其中两个是传递给方法的参数,第三个是this。参数是潜在的最有趣的变量,所以我们要看一下这些。
Immediately, we can see the problem. We’ve been given the value “PENDING” – which is the status that we’re searching for – in the createdBy parameter!
立即,我们可以看到问题所在。我们在createdBy参数中得到了 “PENDING “的值–也就是我们要搜索的状态!这就是问题所在。
Looking closer at the code, we see that we’ve unfortunately transposed the parameters between TasksController and TasksService. This is an easy fix, and if we were to make it – either by swapping the parameters in TasksService or the values passed in from TasksController – then suddenly, our search will start working properly.
仔细观察代码,我们发现我们不幸地将TasksController和TasksService之间的参数换位。这是一个简单的修正,如果我们能做到这一点–要么交换TasksService中的参数,要么交换从TasksController传入的值–那么突然间,我们的搜索将开始正常工作。
7. Summary
7.总结
Here we’ve seen a quick introduction to the Lightrun observability platform, how to get started with it, and some of the benefits it can give us. We’ll be exploring these in more depth in upcoming articles.
在这里我们看到了对Lightrun可观察性平台的快速介绍,如何开始使用它,以及它能给我们带来的一些好处。我们将在接下来的文章中对这些进行更深入的探讨。
Why not use it in your next application, to give more confidence and insight into the way it operates.
为什么不在你的下一个申请中使用它,让人们对它的运作方式更有信心和洞察力。
