1. Introduction
1.介绍
One of the core benefits of Java is the automated memory management with the help of the built-in Garbage Collector (or GC for short). The GC implicitly takes care of allocating and freeing up memory, and thus is capable of handling the majority of memory leak issues.
Java的核心优势之一是在内置的垃圾收集器(简称GC)的帮助下自动管理内存。GC隐含地负责分配和释放内存,因此能够处理大多数的内存泄漏问题。
While the GC effectively handles a good portion of memory, it doesn’t guarantee a foolproof solution to memory leaking. The GC is pretty smart, but not flawless. Memory leaks can still sneak up, even in the applications of a conscientious developer.
虽然GC有效地处理了很大一部分内存,但它并不能保证对内存泄露的解决方案万无一失。GC是相当聪明的,但不是完美无缺的。即使在认真的开发者的应用中,内存泄漏仍然会偷偷出现。
There might still be situations where the application generates a substantial number of superfluous objects, thus depleting crucial memory resources, and sometimes resulting in the whole application’s failure.
仍有可能出现这样的情况:应用程序生成了大量的多余对象,从而耗尽了关键的内存资源,有时甚至导致整个应用程序的失败。
Memory leaks are a genuine problem in Java. In this tutorial, we’ll learn what the potential causes of memory leaks are, how to recognize them at runtime, and how to deal with them in our application.
内存泄漏是Java中的一个真正问题。在本教程中,我们将学习内存泄漏的潜在原因是什么,如何在运行时识别它们,以及如何在我们的应用程序中处理它们。
2. What Is a Memory Leak
2.什么是内存泄漏?
A Memory Leak is a situation where there are objects present in the heap that are no longer used, but the garbage collector is unable to remove them from memory, and therefore, they’re unnecessarily maintained.
内存泄漏是一种情况,在堆中存在不再使用的对象,但垃圾收集器无法将其从内存中移除,因此,它们被不必要地维护。
A memory leak is bad because it blocks memory resources and degrades system performance over time. If not dealt with, the application will eventually exhaust its resources, finally terminating with a fatal java.lang.OutOfMemoryError.
内存泄漏是不好的,因为它阻塞了内存资源,并随着时间的推移降低了系统性能。如果不加以处理,应用程序最终会耗尽其资源,最后以致命的java.lang.OutOfMemoryError终止。
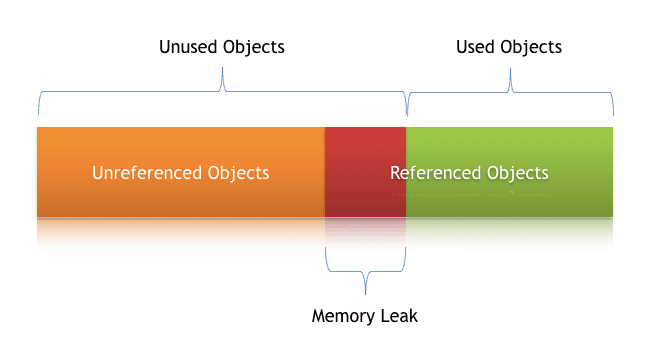
There are two different types of objects that reside in Heap memory, referenced and unreferenced. Referenced objects are those that still have active references within the application, whereas unreferenced objects don’t have any active references.
有两种不同类型的对象驻留在堆内存中,被引用和未引用。被引用的对象是那些在应用程序中仍有活动引用的对象,而未引用的对象没有任何活动引用。
The garbage collector removes unreferenced objects periodically, but it never collects the objects that are still being referenced. This is where memory leaks can occur:
垃圾收集器会定期删除未被引用的对象,但它从未收集仍被引用的对象。这就是可能发生内存泄露的地方。
Symptoms of a Memory Leak
记忆泄漏的症状
- Severe performance degradation when the application is continuously running for a long time
- OutOfMemoryError heap error in the application
- Spontaneous and strange application crashes
- The application is occasionally running out of connection objects.
Let’s have a closer look at some of these scenarios and how to deal with them.
让我们仔细看看其中的一些情况以及如何处理它们。
3. Types of Memory Leaks in Java
3.Java中的内存泄漏类型
In any application, memory leaks can occur for numerous reasons. In this section, we’ll discuss the most common ones.
在任何应用程序中,内存泄漏都可能由于许多原因而发生。在本节中,我们将讨论最常见的原因。
3.1. Memory Leak Through static Fields
3.1.通过静态字段的内存泄漏
The first scenario that can cause a potential memory leak is heavy use of static variables.
第一个可能导致潜在内存泄漏的情况是大量使用静态变量。
In Java, static fields have a life that usually matches the entire lifetime of the running application (unless ClassLoader becomes eligible for garbage collection).
在Java中,静态字段的寿命通常与运行中的应用程序的整个寿命相匹配(除非ClassLoader有资格进行垃圾收集)。
Let’s create a simple Java program that populates a static List:
让我们创建一个简单的Java程序,填充一个静态列表:。
public class StaticTest {
    public static List<Double> list = new ArrayList<>();

    public void populateList() {
        for (int i = 0; i < 10000000; i++) {
            list.add(Math.random());
        }
        Log.info("Debug Point 2");
    }

    public static void main(String[] args) {
        Log.info("Debug Point 1");
        new StaticTest().populateList();
        Log.info("Debug Point 3");
    }
}
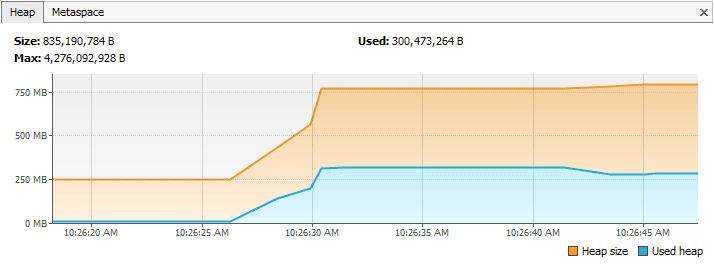
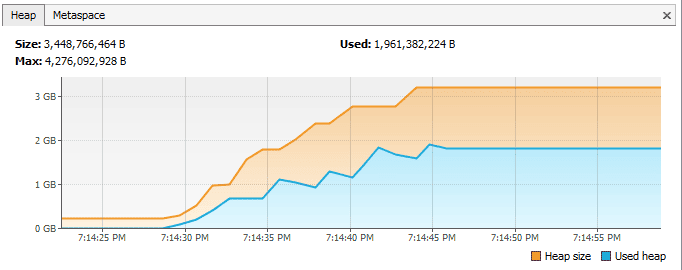
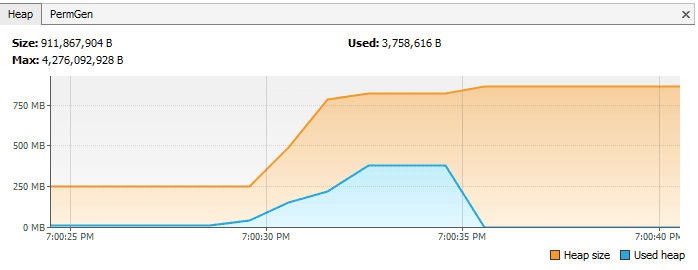
If we analyze the Heap memory during this program execution, then we’ll see that between debug points 1 and 2, the heap memory increased as expected.
如果我们分析这个程序执行过程中的堆内存,那么我们会看到,在调试点1和2之间,堆内存如期增加。
But when we leave the populateList() method at the debug point 3, the heap memory isn’t yet garbage collected, as we can see in this VisualVM response:
但是当我们在调试点3离开populateList()方法时,堆内存还没有被垃圾回收,我们可以在这个VisualVM响应中看到。
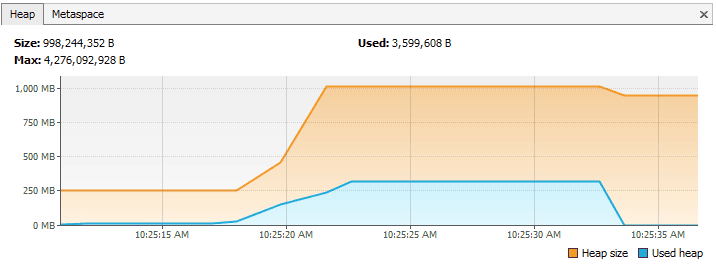
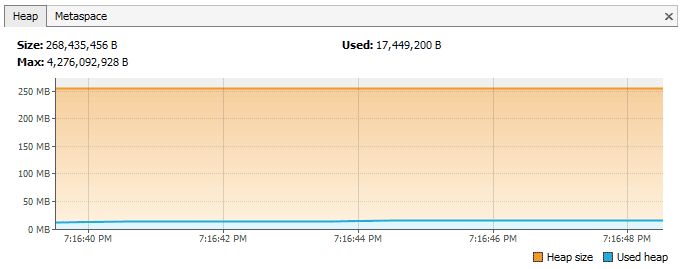
However, if we just drop the keyword static in line number 2 of the above program, then it’ll bring a drastic change to the memory usage, as shown in this Visual VM response:
然而,如果我们只是在上述程序的第2行去掉关键字static,那么就会给内存的使用带来巨大的变化,如这个Visual VM响应所示。
The first part until the debug point is almost the same as what we obtained in the case of static. But this time, after we leave the populateList() method, all the memory of the list is garbage collected because we don’t have any reference to it.
直到调试点的第一部分与我们在static的情况下得到的几乎一样。但是这一次,在我们离开populateList()方法之后,列表的所有内存都被垃圾回收了,因为我们没有任何对它的引用。
So we need to pay very close attention to our usage of static variables. If collections or large objects are declared as static, then they remain in the memory throughout the lifetime of the application, thus blocking vital memory that could otherwise be used elsewhere.
因此,我们需要密切关注static变量的使用。如果集合或大型对象被声明为static,那么它们将在应用程序的整个生命周期中保留在内存中,从而阻塞了本来可以用于其他地方的重要内存。
How to Prevent It?
如何预防?。
- Minimize the use of static variables.
- When using singletons, rely upon an implementation that lazily loads the object, instead of eagerly loading.
3.2. Through Unclosed Resources
3.2.通过未关闭的资源
Whenever we make a new connection or open a stream, the JVM allocates memory for these resources. A few examples of this include database connections, input streams, and session objects.
每当我们建立一个新的连接或打开一个流时,JVM都会为这些资源分配内存。这方面的几个例子包括数据库连接、输入流和会话对象。
Forgetting to close these resources can block the memory, thus keeping them out of the reach of the GC. This can even happen in case of an exception that prevents the program execution from reaching the statement that’s handling the code to close these resources.
忘记关闭这些资源会阻塞内存,从而使它们处于GC的范围之外。这甚至可能发生在发生异常的情况下,使程序执行无法到达处理关闭这些资源的代码的语句。
In either case, the open connection left from the resources consumes memory, and if we don’t deal with them, they can deteriorate performance, and even result in an OutOfMemoryError.
无论是哪种情况,从资源中留下的开放连接都会消耗内存,如果我们不处理它们,它们会使性能恶化,甚至导致OutOfMemoryError。
How to Prevent It?
如何预防?。
- Always use finally block to close resources.
- The code (even in the finally block) that closes the resources shouldn’t have any exceptions itself.
- When using Java 7+, we can make use of the try-with-resources block.
3.3. Improper equals() and hashCode() Implementations
3.3.不正确的equals()和hashCode()实现
When defining new classes, a very common oversight is not writing proper overridden methods for the equals() and hashCode() methods.
在定义新类时,一个非常常见的疏忽是没有为equals()和hashCode()方法编写适当的重载方法。
HashSet and HashMap use these methods in many operations, and if they’re not overridden correctly, they can become a source for potential memory leak problems.
HashSet和HashMap在许多操作中使用这些方法,如果它们没有被正确重载,就会成为潜在的内存泄漏问题的来源。
Let’s take an example of a trivial Person class, and use it as a key in a HashMap:
让我们以一个微不足道的Person类为例,将其作为HashMap中的一个键。
public class Person {
    public String name;

    public Person(String name) {
        this.name = name;
    }
}
Now we’ll insert duplicate Person objects into a Map that uses this key.
现在我们将把重复的Person对象插入到使用该键的Map中。
Remember that a Map can’t contain duplicate keys:
记住,一个Map不能包含重复的键。
@Test
public void givenMap_whenEqualsAndHashCodeNotOverridden_thenMemoryLeak() {
    Map<Person, Integer> map = new HashMap<>();
    for(int i=0; i<100; i++) {
        map.put(new Person("jon"), 1);
    }
    Assert.assertFalse(map.size() == 1);
}
Here we’re using Person as a key. Since Map doesn’t allow duplicate keys, the numerous duplicate Person objects that we inserted as a key shouldn’t increase the memory.
这里我们使用Person作为一个键。由于Map不允许重复的键,我们插入的无数重复的Person对象作为键不应该增加内存。
But since we haven’t defined the proper equals() method, the duplicate objects pile up and increase the memory, which is why we see more than one object in the memory. The Heap Memory in VisualVM for this looks like:
但是由于我们没有定义合适的equals()方法,重复的对象堆积起来,增加了内存,这就是为什么我们在内存中看到不止一个对象。在VisualVM中,这个的Heap Memory看起来是这样的。
However, if we’d overridden the equals() and hashCode() methods properly, then only one Person object would exist in this Map.
然而,如果我们正确地覆盖了equals()和hashCode()方法,那么在这个Map中就只有一个Person对象。
Let’s take a look at the proper implementations of equals() and hashCode() for our Person class:
让我们来看看equals()和hashCode()在我们的Person类中的正确实现。
public class Person {
    public String name;

    public Person(String name) {
        this.name = name;
    }

    @Override
    public boolean equals(Object o) {
        if (o == this) return true;
        if (!(o instanceof Person)) {
            return false;
        }
        Person person = (Person) o;
        return person.name.equals(name);
    }

    @Override
    public int hashCode() {
        int result = 17;
        result = 31 * result + name.hashCode();
        return result;
    }
}
And in this case, the following assertions would be true:
而在这种情况下,以下断言将是真实的。
@Test
public void givenMap_whenEqualsAndHashCodeNotOverridden_thenMemoryLeak() {
    Map<Person, Integer> map = new HashMap<>();
    for(int i=0; i<2; i++) {
        map.put(new Person("jon"), 1);
    }
    Assert.assertTrue(map.size() == 1);
}
After properly overriding equals() and hashCode(), the Heap Memory for the same program looks like:
在正确覆盖equals()和hashCode()之后,同一程序的堆内存看起来像。
Another option is using an ORM tool like Hibernate, which uses the equals() and hashCode() methods to analyze the objects and saves them in the cache.
另一个选择是使用像Hibernate这样的ORM工具,它使用equals()和hashCode()方法来分析对象并将它们保存在缓存中。
The chance of memory leaks is quite high if these methods aren’t overridden because Hibernate wouldn’t be able to compare objects and would fill its cache with duplicate objects.
如果不重载这些方法,发生内存泄漏的几率就相当高,因为Hibernate将无法对对象进行比较,并将用重复的对象填充其缓存。
How to Prevent It?
如何预防?。
- As a rule of thumb, when defining new entities, always override the equals() and hashCode() methods.
- It’s not enough to just override, these methods must be overridden in an optimal way as well.
For more information, visit our tutorials Generate equals() and hashCode() with Eclipse and Guide to hashCode() in Java.
欲了解更多信息,请访问我们的教程用Eclipse生成equals()和hashCode()以及Java中hashCode()指南。
3.4. Inner Classes That Reference Outer Classes
3.4.引用外部类的内部类
This happens in the case of non-static inner classes (anonymous classes). For initialization, these inner classes always require an instance of the enclosing class.
这发生在非静态内层类(匿名类)的情况下。对于初始化,这些内部类总是需要一个包围类的实例。
Every non-static Inner Class has, by default, an implicit reference to its containing class. If we use this inner class’ object in our application, then even after our containing class’ object goes out of scope, it won’t be garbage collected.
每一个非静态的内层类,默认都有一个对其包含类的隐式引用。如果我们在应用程序中使用这个内层类的对象,那么即使我们的包含类的对象超出了范围,它也不会被垃圾回收。
Consider a class that holds the reference to lots of bulky objects and has a non-static inner class. When we create an object of just the inner class, the memory model looks like:
考虑一个持有大量笨重对象的引用的类,并且有一个非静态的内类。当我们创建一个只有内层类的对象时,内存模型看起来像。
However, if we just declare the inner class as static, then the same memory model looks like this:
然而,如果我们只是将内层类声明为静态,那么同样的内存模型看起来是这样的。
This happens because the inner class object implicitly holds a reference to the outer class object, thereby making it an invalid candidate for garbage collection. The same happens in the case of anonymous classes.
这是因为内层类对象隐含地持有对外层类对象的引用,从而使其成为垃圾收集的无效候选者。同样的情况也发生在匿名类的情况下。
How to Prevent It?
如何预防?。
- If the inner class doesn’t need access to the containing class members, consider turning it into a static class.
3.5. Through finalize() Methods
3.5.通过finalize()方法
Use of finalizers is yet another source of potential memory leak issues. Whenever a class’ finalize() method is overridden, then objects of that class aren’t instantly garbage collected. Instead, the GC queues them for finalization, which occurs at a later point in time.
使用终结者是潜在内存泄漏问题的另一个来源。每当一个类的finalize()方法被重载,那么该类的对象就不会立即被垃圾回收。相反,GC会将它们排队等待最终化,这在稍后的时间点发生。
Additionally, if the code written in the finalize() method isn’t optimal, and if the finalizer queue can’t keep up with the Java garbage collector, then sooner or later our application is destined to meet an OutOfMemoryError.
此外,如果写在finalize()方法中的代码不是最佳的,如果finalizer队列不能跟上Java垃圾收集器的速度,那么我们的应用程序迟早会遇到OutOfMemoryError。
To demonstrate this, let’s imagine that we have a class for which we’ve overridden the finalize() method, and that the method takes a little bit of time to execute. When a large number of objects of this class get garbage collected, it looks like this in VisualVM:
为了证明这一点,让我们想象一下,我们有一个类,我们为它重载了finalize()方法,并且该方法需要一点时间来执行。当这个类的大量对象被垃圾回收时,在VisualVM中看起来是这样的。
However, if we just remove the overridden finalize() method, then the same program gives the following response:
然而,如果我们只是去掉重载的finalize()方法,那么同一个程序就会给出如下响应。
How to Prevent It?
如何预防?。
- We should always avoid finalizers.
For more detail about finalize(), we can refer to section 3 (Avoiding Finalizers) in our Guide to the finalize Method in Java.
关于finalize()的更多细节,我们可以参考Java中finalize方法指南中的第3节(Avoiding Finalizers)。
3.6. Interned Strings
3.6.内部的字符串
The Java String pool went through a major change in Java 7 when it was transferred from PermGen to HeapSpace. However, for applications operating on version 6 and below, we need to be more attentive when working with large Strings.
Java String池在Java 7中经历了重大变化,它从PermGen转移到HeapSpace。然而,对于在版本6及以下版本上运行的应用程序,我们在处理大型字符串时需要更加注意。
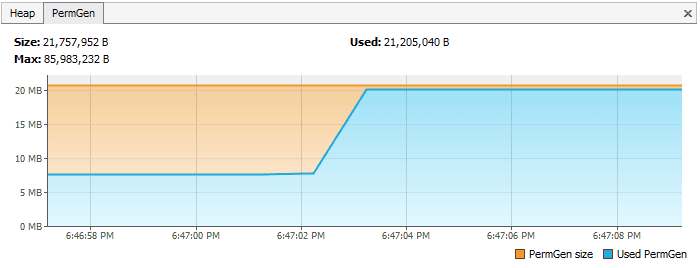
If we read a massive String object, and call intern() on that object, it goes to the string pool, which is located in PermGen (permanent memory), and will stay there as long as our application runs. This blocks the memory and creates a major memory leak in our application.
如果我们读取一个庞大的String对象,并对该对象调用intern(),它就会进入位于PermGen(永久内存)中的字符串池,并且只要我们的应用程序运行,它就会留在那里。这就会阻塞内存,并在我们的应用程序中产生一个主要的内存泄漏。
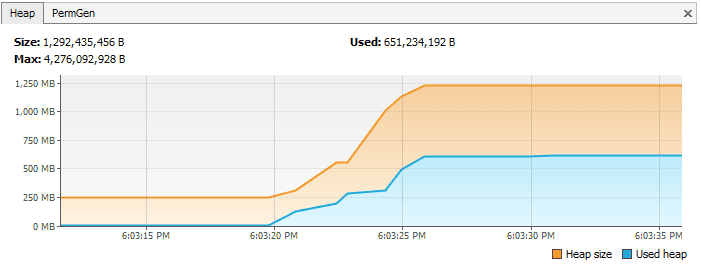
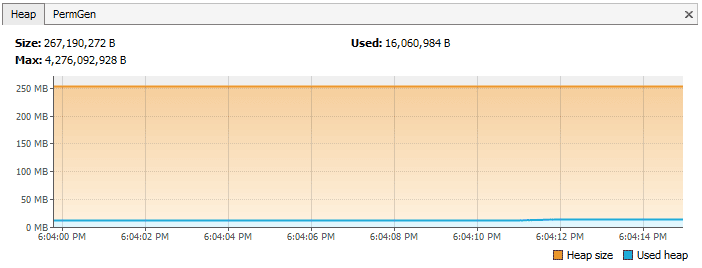
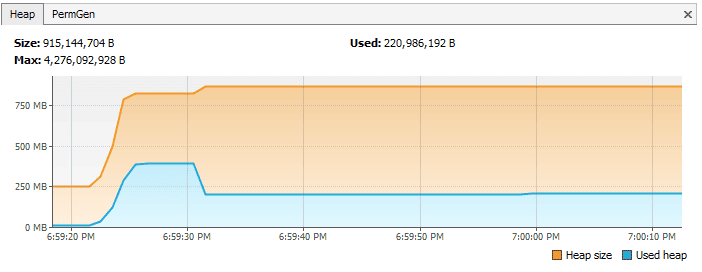
The PermGen for this case in JVM 1.6 looks like this in VisualVM:
在JVM 1.6中,这种情况的PermGen在VisualVM中看起来是这样的。
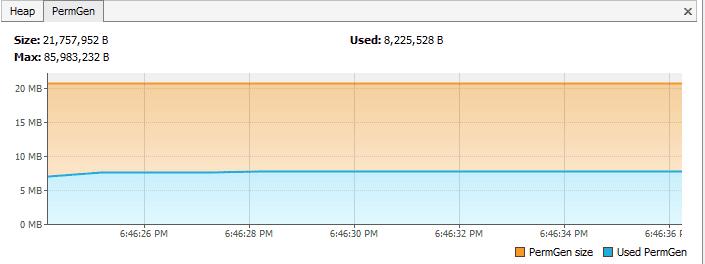
In contrast, if we just read a string from a file in a method, and don’t intern it, then the PermGen looks like:
相比之下,如果我们只是在一个方法中从文件中读取一个字符串,而不对其进行实习,那么PermGen看起来像。
How to Prevent It?
如何预防?。
- The simplest way to resolve this issue is by upgrading to the latest Java version, as String pool moved to HeapSpace starting with Java version 7.
- If we’re working on large Strings, we can increase the size of the PermGen space to avoid any potential OutOfMemoryErrors:
-XX:MaxPermSize=512m
3.7. Using ThreadLocals
3.7.使用ThreadLocals
ThreadLocal (discussed in detail in the Introduction to ThreadLocal in Java tutorial) is a construct that gives us the ability to isolate state to a particular thread, and thus allows us to achieve thread safety.
ThreadLocal(在Introduction to ThreadLocal in Java 教程中详细讨论)是一个构造,它使我们能够将状态隔离到特定的线程,从而允许我们实现线程安全。
When using this construct, each thread will hold an implicit reference to its copy of a ThreadLocal variable and will maintain its own copy, instead of sharing the resource across multiple threads, as long as the thread is alive.
当使用这种结构时,每个线程将持有对其ThreadLocal变量副本的隐式引用,并将维护自己的副本,而不是在多个线程之间共享资源,只要该线程还活着。
Despite its advantages, the use of ThreadLocal variables is controversial, as they’re infamous for introducing memory leaks if not used properly. Joshua Bloch once commented on thread local usage that:
尽管它有很多优点,但使用ThreadLocal变量是有争议的,因为如果使用不当,它们会带来内存泄漏,这是臭名昭著的。Joshua Bloch曾就线程局部的使用发表评论说。
“Sloppy use of thread pools in combination with sloppy use of thread locals can cause unintended object retention, as has been noted in many places. But placing the blame on thread locals is unwarranted.”
“对线程池的粗心使用与对线程局部的粗心使用相结合,会造成非预期的对象保留,这一点在很多地方都已经指出。但将责任归咎于线程定位器是毫无道理的。”
Memory Leaks with ThreadLocals
使用ThreadLocals的内存泄漏。
ThreadLocals are supposed to be garbage collected once the holding thread is no longer alive. But the problem arises when we use ThreadLocals along with modern application servers.
ThreadLocals应该在持有线程不再存活时被垃圾回收。但是当我们将ThreadLocals与现代应用服务器一起使用时,问题就来了。
Modern application servers use a pool of threads to process requests, instead of creating new ones (for example, the Executor in the case of Apache Tomcat). Moreover, they also use a separate classloader.
现代应用服务器使用一个线程池来处理请求,而不是创建新的线程(例如, Apache Tomcat中的Executor)。此外,它们还使用一个单独的类加载器。
Since Thread Pools in application servers work on the concept of thread reuse, they’re never garbage collected; instead, they’re reused to serve another request.
由于应用服务器中的线程池是基于线程重用的概念工作的,因此它们永远不会被垃圾回收;相反,它们被重用来为另一个请求服务。
If any class creates a ThreadLocal variable, but doesn’t explicitly remove it, then a copy of that object will remain with the worker Thread even after the web application is stopped, thus preventing the object from being garbage collected.
如果任何类创建了一个ThreadLocal变量,但没有明确地将其删除,那么该对象的副本将保留在工作者Thread中,即使在Web应用程序停止后,从而防止该对象被垃圾回收。
How to Prevent It?
如何预防?。
- It’s good practice to clean-up ThreadLocals when we’re no longer using them. ThreadLocals provide the remove() method, which removes the current thread’s value for this variable.
- Don’t use ThreadLocal.set(null) to clear the value. It doesn’t actually clear the value, but will instead look up the Map associated with the current thread and set the key-value pair as the current thread and null, respectively.
- It’s best to consider ThreadLocal a resource that we need to close in a finally block, even in the case of an exception::
try {
    threadLocal.set(System.nanoTime());
    //... further processing
}
finally {
    threadLocal.remove();
}
4. Other Strategies for Dealing With Memory Leaks
4.处理内存泄漏的其他策略
Although there’s no one-size-fits-all solution when dealing with memory leaks, there are some ways by which we can minimize these leaks.
尽管在处理内存泄漏问题时没有一个放之四海而皆准的解决方案,但我们可以通过一些方法将这些泄漏降到最低。
4.1. Enable Profiling
4.1.启用剖析功能
Java profilers are tools that monitor and diagnose the memory leaks through the application. They analyze what’s going on internally in our application, like how we allocate memory.
Java剖析器是通过应用程序监测和诊断内存泄漏的工具。它们分析我们的应用程序内部发生了什么,比如我们如何分配内存。
Using profilers, we can compare different approaches and find areas where we can optimally use our resources.
使用剖析器,我们可以比较不同的方法,并找到我们可以最佳利用资源的领域。
Throughout section 3 of this tutorial, we used Java VisualVM. Please check out our Guide to Java Profilers to learn about different types of profilers, like Mission Control, JProfiler, YourKit, Java VisualVM, and the Netbeans Profiler.
在本教程的整个第三部分,我们使用了Java VisualVM。请查看我们的Java剖析器指南以了解不同类型的剖析器,如Mission Control、JProfiler、YourKit、Java VisualVM和Netbeans剖析器。
4.2. Verbose Garbage Collection
4.2.冗长的垃圾回收
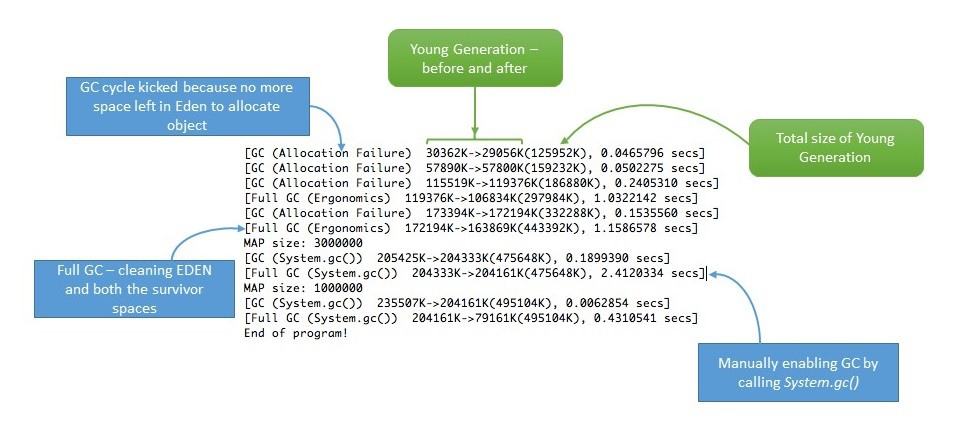
By enabling verbose garbage collection, we can track the detailed trace of the GC. To enable this, we need to add the following to our JVM configuration:
通过启用Verbose垃圾收集,我们可以跟踪GC的详细轨迹。为了启用这一点,我们需要在我们的JVM配置中添加以下内容。
-verbose:gcBy adding this parameter, we can see the details of what’s happening inside the GC:
通过添加这个参数,我们可以看到GC内部发生的细节。
4.3. Use Reference Objects to Avoid Memory Leaks
4.3.使用引用对象以避免内存泄漏
We can also resort to reference objects in Java that come built-in with the java.lang.ref package to deal with memory leaks. Using the java.lang.ref package, instead of directly referencing objects, we use special references to objects that allow them to be easily garbage collected.
我们还可以借助于Java中的引用对象,这些对象内置了java.lang.ref包,以处理内存泄漏问题。使用java.lang.ref包,我们不是直接引用对象,而是使用对对象的特殊引用,使其容易被垃圾回收。
Reference queues make us aware of the actions the Garbage Collector performs. For more information, we can read the Soft References in Java tutorial, specifically section 4.
引用队列使我们了解到垃圾收集器所执行的操作。关于更多信息,我们可以阅读Java中的软引用教程,特别是第4节。
4.4. Eclipse Memory Leak Warnings
4.4.Eclipse的内存泄漏警告
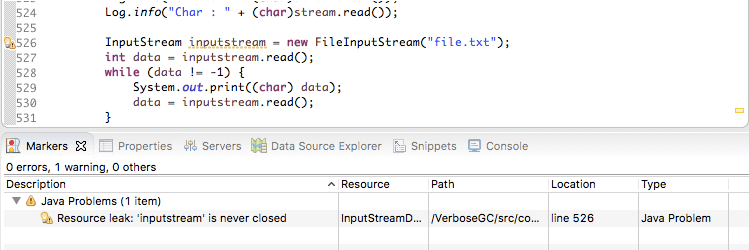
For projects on JDK 1.5 and above, Eclipse shows warnings and errors whenever it encounters obvious cases of memory leaks. So when developing in Eclipse, we can regularly visit the “Problems” tab and be more vigilant about memory leak warnings (if any):
对于JDK 1.5及以上版本的项目,Eclipse只要遇到明显的内存泄漏情况,就会显示警告和错误。因此,在Eclipse中开发时,我们可以定期访问 “问题 “选项卡,对内存泄漏警告(如果有的话)提高警惕。
4.5. Benchmarking
4.5.基准测试
We can measure and analyze the Java code’s performance by executing benchmarks. This way, we can compare the performance of alternative approaches to do the same task. This can help us choose the best approach, and may help us conserve memory.
我们可以通过执行基准测试来衡量和分析Java代码的性能。这样,我们就可以比较其他方法的性能来完成同样的任务。这可以帮助我们选择最好的方法,并可能帮助我们节约内存。
For more information about benchmarking, please head over to our Microbenchmarking with Java tutorial.
有关基准测试的更多信息,请前往我们的用Java进行微基准测试教程。
4.6. Code Reviews
4.6.代码审查
Finally, we always have the classic, old-school way of doing a simple code walk-through.
最后,我们总是以经典的、老式的方式来做一个简单的代码演练。
In some cases, even this trivial looking method can help in eliminating some common memory leak problems.
在某些情况下,即使是这种微不足道的寻找方法也能帮助消除一些常见的内存泄漏问题。
5. Conclusion
5.结论
In layman’s terms, we can think of a memory leak as a disease that degrades our application’s performance by blocking vital memory resources. And like all other diseases, if not cured, it can result in fatal application crashes over time.
通俗地说,我们可以把内存泄漏看作是一种疾病,它通过阻塞重要的内存资源来降低我们应用程序的性能。就像所有其他疾病一样,如果不加以治愈,随着时间的推移,它可能会导致致命的应用程序崩溃。
Memory leaks are tricky to solve, and finding them requires intricate mastery and command over the Java language. While dealing with memory leaks, there’s no one-size-fits-all solution, as leaks can occur through a wide range of diverse events.
内存泄漏的解决很棘手,找到它们需要对Java语言有复杂的掌握和控制。在处理内存泄漏问题时,没有一个放之四海而皆准的解决方案,因为泄漏可能是通过各种不同的事件发生的。
However, if we resort to best practices and regularly perform rigorous code walk-throughs and profiling, we can minimize the risk of memory leaks in our application.
然而,如果我们采用最佳做法,定期进行严格的代码检查和剖析,我们就可以将应用程序中的内存泄漏风险降到最低。
As always, the code snippets used to generate the VisualVM responses depicted in this article are available on GitHub.
