1. Overview
1.概述
Sometimes writing code that just runs is not enough. We might want to know what goes on internally such as how memory is allocated, consequences of using one coding approach over another, implications of concurrent executions, areas to improve performance, etc. We can use profilers for this.
有时,仅仅编写运行的代码是不够的。我们可能想知道内部发生了什么,例如内存是如何分配的,使用一种编码方法的后果,并发执行的影响,提高性能的领域,等等。我们可以使用剖析器来实现这一点。
A Java Profiler is a tool that monitors Java bytecode constructs and operations at the JVM level. These code constructs and operations include object creation, iterative executions (including recursive calls), method executions, thread executions, and garbage collections.
Java剖析器是一种工具,在JVM层面监控Java字节码构造和操作。这些代码构造和操作包括对象创建、迭代执行(包括递归调用)、方法执行、线程执行和垃圾回收。
In this article, we’ll be discussing the main Java Profilers: JProfiler, YourKit, Java VisualVM, the Netbeans Profiler, and the IntelliJ Profiler.
在这篇文章中,我们将讨论主要的Java剖析器。JProfiler、YourKit、Java VisualVM、Netbeans Profiler,以及IntelliJ Profiler。
2. JProfiler
2.JProfiler
JProfiler is a top choice for many developers. With an intuitive UI, JProfiler provides interfaces for viewing system performance, memory usage, potential memory leaks, and thread profiling.
JProfiler是许多开发者的首选。通过一个直观的用户界面,JProfiler提供了查看系统性能、内存使用情况、潜在的内存泄漏和线程分析的界面。
With this information, we can easily know what we need to optimize, eliminate, or change – in the underlying system.
有了这些信息,我们可以很容易地知道我们需要优化、消除或改变什么–在基础系统中。
This product requires purchasing a license, but also offers a free trial.
该产品需要购买许可证,但也提供免费试用。
Here’s what the JProfiler’s interface looks like:
下面是JProfiler的界面的样子。
 JProfiler overview interface with features
Like most profilers, we can use this tool for both local and remote applications. This means that it’s possible to profile Java applications running on remote machines without having to install anything on them.
像大多数剖析器一样,我们可以对本地和远程应用程序使用这个工具。这意味着可以对运行在远程机器上的Java应用程序进行剖析,而不需要在这些机器上安装任何东西。
JProfiler also provides advanced profiling for both SQL and NoSQL databases. It provides specific support for profiling JDBC, JPA/Hibernate, MongoDB, Casandra, and HBase databases.
JProfiler还为SQL和NoSQL数据库提供高级剖析。它对JDBC、JPA/Hibernate、MongoDB、Casandra和HBase数据库的剖析提供了具体支持。
The below screenshot shows the JDBC probing interface with a list of current connections:
下面的屏幕截图显示了JDBC探测界面和当前连接的列表。
 JProfiler database probing view
If we are keen on learning about the call tree of interactions with our database and seeing connections that may be leaked, JProfiler nicely handles this.
如果我们热衷于了解与数据库交互的调用树,看到可能被泄露的连接,JProfiler很好地处理了这一点。
Live Memory is one feature of JProfiler that allows us to see current memory usage by our application. We can view memory usage for object declarations and instances or for the full call tree.
实时内存是JProfiler的一项功能,它允许我们查看我们的应用程序的当前内存使用情况。我们可以查看对象声明和实例或整个调用树的内存使用情况。
In the case of the allocation call tree, we can choose to view the call tree of live objects, garbage-collected objects, or both. We can also decide if this allocation tree should be for a particular class or package or all classes.
在分配调用树的情况下,我们可以选择查看实时对象的调用树、垃圾收集的对象或两者。我们还可以决定这个分配树应该是针对某个特定的类或包,还是针对所有的类。
The screen below shows the live memory usage by all objects with instance counts:
下面的屏幕显示了所有对象的实时内存使用情况和实例计数。

JProfiler supports integration with popular IDEs such as Eclipse, NetBeans, and IntelliJ. It’s even possible to navigate from snapshot to source code!
JProfiler支持与流行的IDE集成,如Eclipse、NetBeans和IntelliJ。它甚至可以从快照导航到源代码!
3. YourKit
3.YourKit[/strong
YourKit Java Profiler runs on many different platforms and provides separate installations for each supported operating system (Windows, MacOS, Linux, Solaris, FreeBSD, etc.).
YourKit Java Profiler可以在许多不同的平台上运行,并为每个支持的操作系统(Windows, MacOS, Linux, Solaris, FreeBSD等)提供单独的安装。
Like JProfiler, YourKit has core features for visualizing threads, garbage collections, memory usage, and memory leaks, with support for local and remote profiling via ssh tunneling.
与JProfiler一样,YourKit拥有可视化线程、垃圾回收、内存使用和内存泄露的核心功能,并且支持通过ssh隧道进行本地和远程剖析。
YourKit offers both paid licenses for commercial use, with a free trial, and lower cost or free licenses for non-commercial use.
YourKit既提供用于商业用途的付费许可证,又提供用于非商业用途的较低费用或免费许可证。
Here’s a quick look at the memory profiling results of a Tomcat server application:
下面是对Tomcat服务器应用程序的内存分析结果的快速浏览。
 YourKit Java Profiler memory profiling of Tomcat server application
YourKit Java Profiler对Tomcat服务器程序进行内存分析
YourKit also comes in handy those times when we want to profile thrown exceptions. We can easily find out what types of exceptions were thrown and the number of times each exception occurred.
当我们想要描述抛出的异常时,YourKit也会派上用场。我们可以很容易地找出被抛出的异常类型以及每个异常发生的次数。
YourKit has an interesting CPU profiling feature that allows focused profiling on certain areas of our code such as methods or subtrees in threads. This is very powerful as it allows for conditional profiling through its what-if feature.
YourKit有一个有趣的CPU剖析功能,允许对我们代码的某些区域进行重点剖析,比如线程中的方法或子树。这非常强大,因为它允许通过其what-if功能进行有条件的剖析。
Figure 5 shows an example of the thread-profiling interface:
图5显示了线程剖析界面的一个例子。
 Figure 5. YourKit Java Profiler threads profiling interface
图5.YourKit Java Profiler线程剖析界面</a
We can also profile SQL, and NoSQL database calls with YourKit. It even provides a view for actual queries that were executed.
我们还可以用YourKit对SQL和NoSQL数据库的调用进行备案。它甚至为实际执行的查询提供了一个视图。
Though this is not a technical consideration, the permissive licensing model of YourKit makes it a good choice for multi-user or distributed teams, as well as for single-license purchases.
虽然这不是一个技术上的考虑,但YourKit的许可模式使它成为多用户或分布式团队的一个很好的选择,同时也是单一许可的购买。
4. Java VisualVM
4.Java VisualVM[/strong]
Java VisualVM is a simplified yet robust profiling tool for Java applications. This is a free, open-source profiler.
Java VisualVM是一个简化但强大的Java应用程序的剖析工具。这是一个免费的、开源的剖析器。
This tool was bundled with the Java Development Kit (JDK) up to JDK 8, but was removed in JDK 9 and is now distributed as a standalone tool: VisualVM Download.
这个工具在JDK 8之前一直与Java开发工具包(JDK)捆绑在一起,但在JDK 9中被删除,现在作为一个独立的工具分发。VisualVM 下载。
Its operation relies on other standalone tools provided in the JDK, such as JConsole, jstat, jstack, jinfo, and jmap.
它的操作依赖于JDK中提供的其他独立工具,例如JConsole、jstat、jstack、jinfo和jmap。
Below, we can see a simple overview interface of an ongoing profiling session using Java VisualVM:
下面,我们可以看到一个使用Java VisualVM的正在进行的剖析会话的简单概述界面。
 Java VisualVM local tomcat server app profiling
Java VisualVM local tomcat server app profiling
One interesting advantage of Java VisualVM is that we can extend it to develop new functionalities as plugins. We can then add these plugins to Java VisualVM’s built-in update center.
Java VisualVM的一个有趣的优点是,我们可以扩展它,以开发新的功能作为插件。然后我们可以将这些插件添加到Java VisualVM的内置更新中心。
Java VisualVM supports local and remote profiling, as well as memory and CPU profiling. Connecting to remote applications requires providing credentials (hostname/IP and password as necessary) but does not provide support for ssh tunneling. We can also choose to either enable real-time profiling with instant updates (typically every 2 seconds).
Java VisualVM支持本地和远程剖析,以及内存和CPU剖析。连接到远程应用程序需要提供凭证(必要时提供主机名/IP和密码)但不提供对ssh隧道的支持。我们还可以选择启用即时更新的实时剖析(通常每2秒)。
Below, we can see the memory outlook of a Java application profiled using Java VisualVM:
下面,我们可以看到使用Java VisualVM剖析的一个Java应用程序的内存前景。
 Java VisualVM memory heap histogram
With the snapshot feature of Java VisualVM, we can take snapshots of profiling sessions for later analysis.
利用Java VisualVM的快照功能,我们可以对剖析会话进行快照,以供日后分析。
5. NetBeans Profiler
5.NetBeans分析器
The NetBeans Profiler is bundled with Oracle’s open-source NetBeans IDE.
NetBeans Profiler是与Oracle的开源NetBeans IDE捆绑的。
While this profiler shares a lot of similarities with Java VisualVM, it’s a good choice when we want everything wrapped in one program (IDE + Profiler).
虽然这个剖析器与Java VisualVM有很多相似之处,但当我们想把所有东西都包装在一个程序中(IDE+剖析器)时,它是一个不错的选择。
All other profilers discussed above provide plugins to enhance IDEs integration.
上面讨论的所有其他剖析器都提供了插件,以增强IDE的整合。
Below screenshot shows an example of the NetBeans Profiler interface:
下面的屏幕截图显示了NetBeans Profiler界面的一个例子。
 Netbeans Profiler telemetry interface
Netbeans Profiler is also a good choice for lightweight development and profiling. NetBeans Profiler provides a single window for configuring and controlling the profiling session and displaying the results. It gives a unique feature of knowing how often garbage collection occurs.
Netbeans Profiler也是一个轻量级开发和剖析的好选择。NetBeans Profiler提供了一个单一的窗口来配置和控制剖析会话并显示结果。它提供了一个独特的功能,即了解垃圾收集发生的频率。
6. IntelliJ Profiler
6.IntelliJ分析器
IntelliJ Profiler is a simple, yet powerful tool for CPU and memory allocations profiling. It combines the power of two popular Java profilers: JFR and Async profiler.
IntelliJ Profiler是一个简单而强大的工具,用于CPU和内存分配剖析。它结合了两个流行的Java剖析器的功能。JFR和Async profiler。
While there are some advanced features, the main focus is on ease of use. IntelliJ Profiler allows you to get started in a few clicks without any kind of configuration while providing helpful features to assist you in your day-to-day work as a developer.
虽然有一些高级功能,但主要的重点是易用性。IntelliJ Profiler允许你点击几下就可以开始使用,不需要任何形式的配置,同时提供有用的功能来协助你作为一个开发者的日常工作。
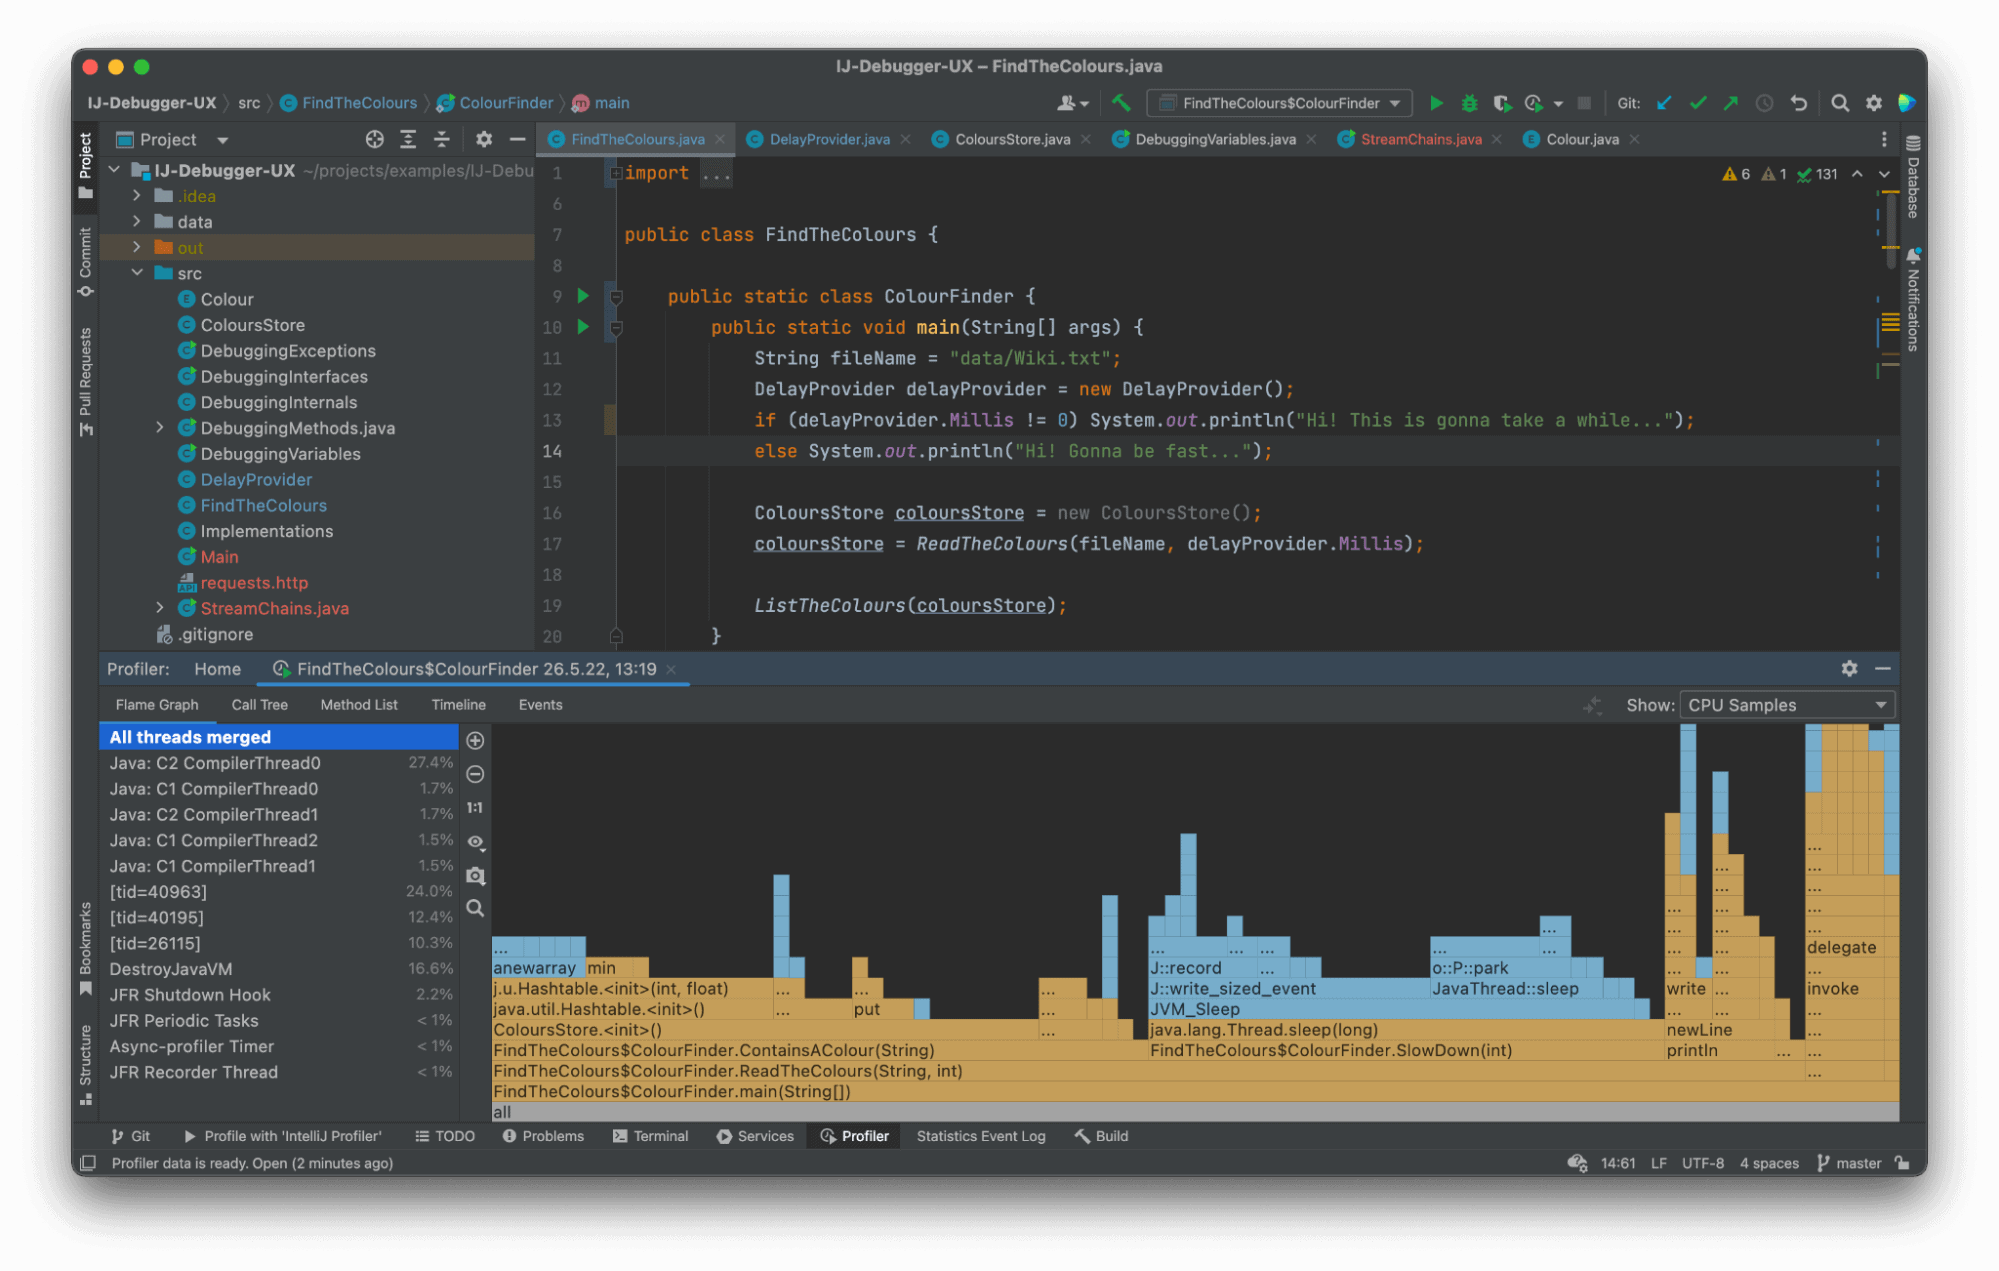
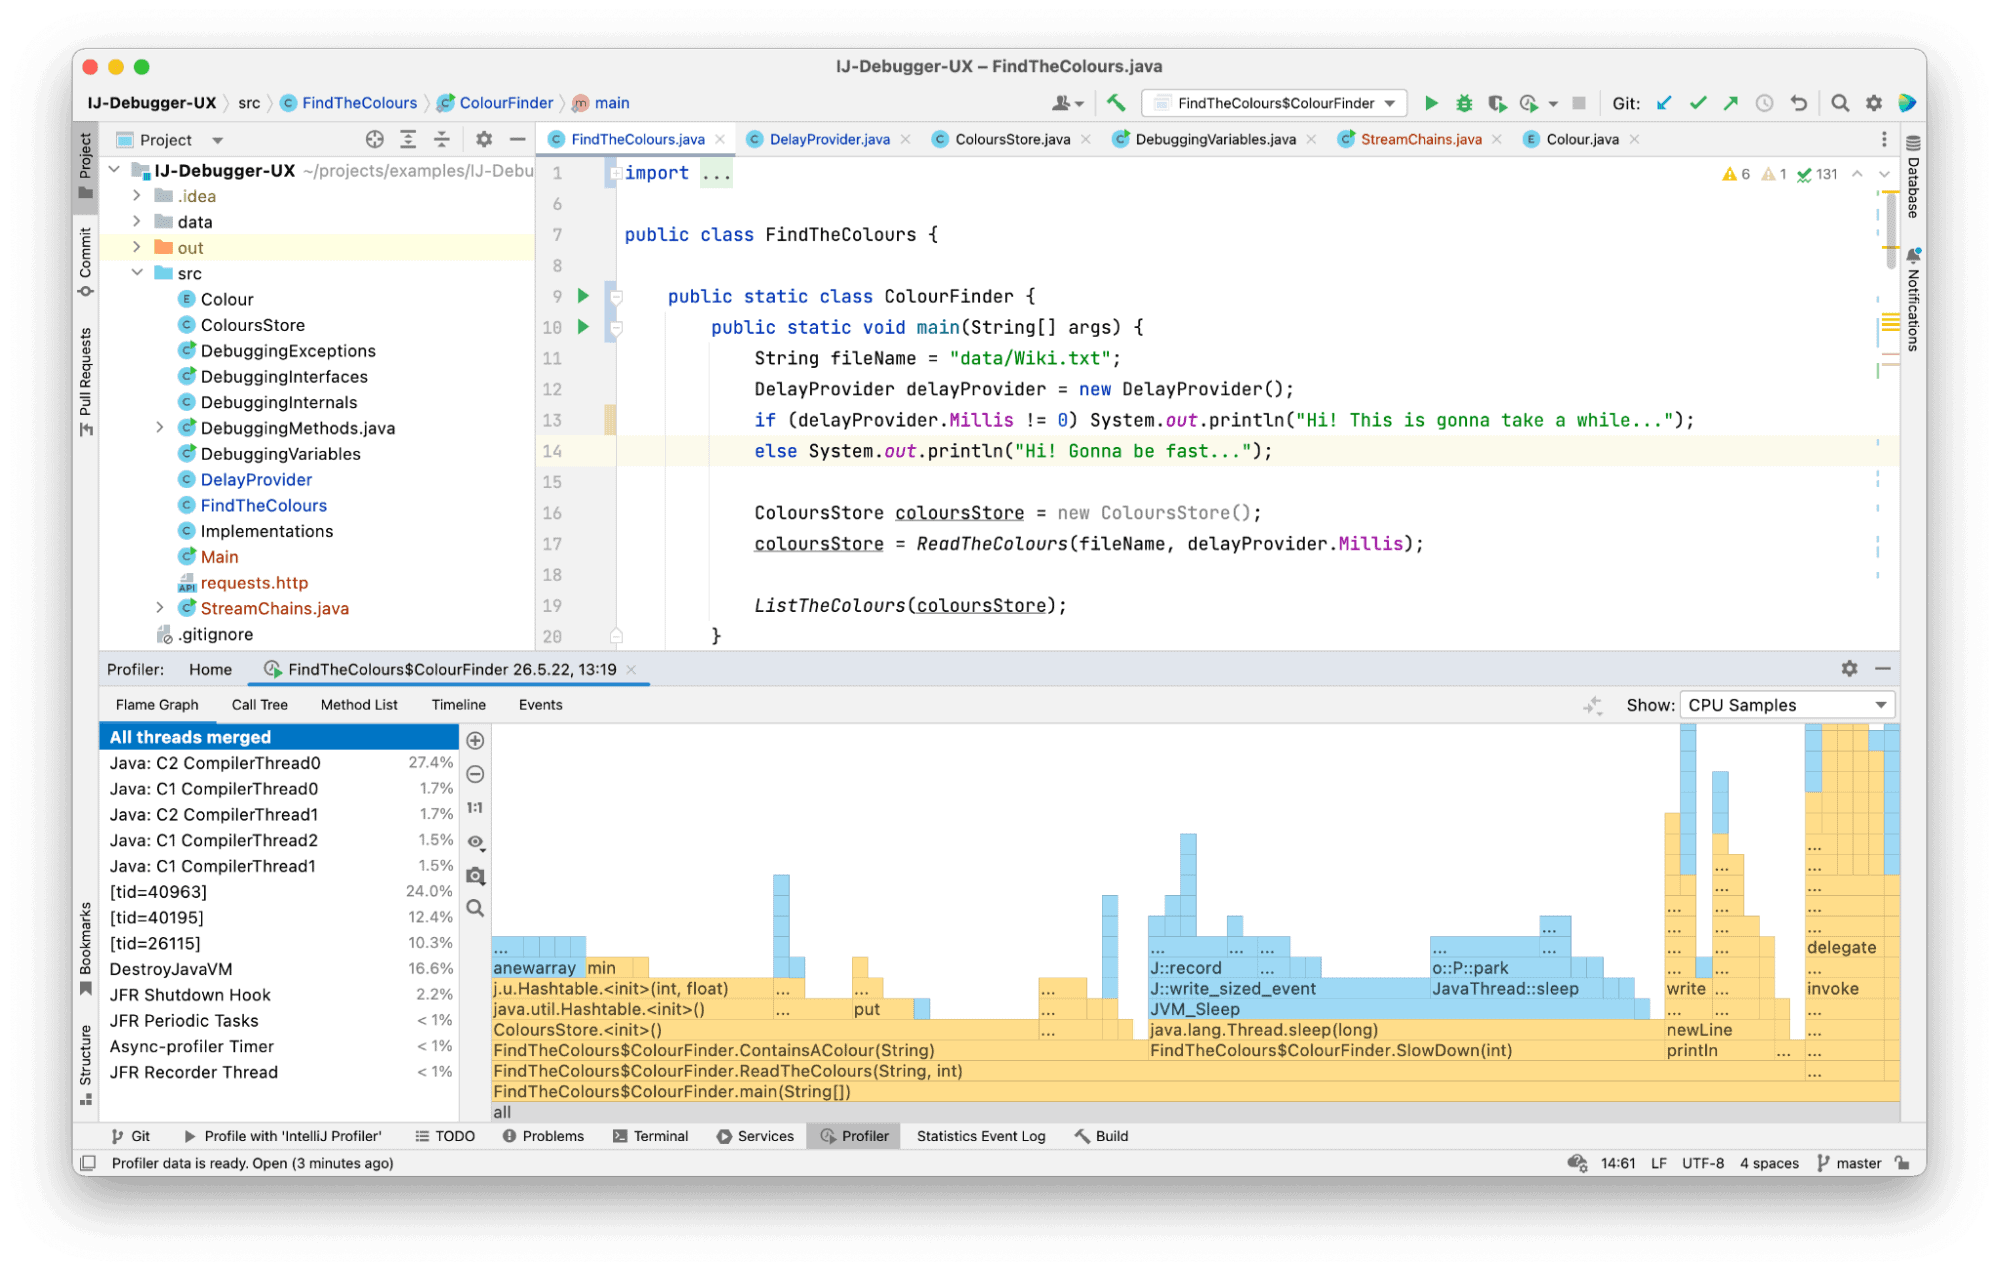
As part of IntelliJ IDEA Ultimate, IntelliJ Profiler can be attached to a process with a single click and we can navigate between a snapshot and the source code as if they were one. Its other features, like differential flame graphs, allow us to visually assess the performance of different approaches and get insights into the runtime operations quickly and efficiently:
作为IntelliJ IDEA Ultimate的一部分,IntelliJ Profiler可以通过一次点击附加到一个进程上,我们可以在快照和源代码之间浏览,就像它们是一体的一样。它的其他功能,如差分火焰图,使我们能够直观地评估不同方法的性能,快速有效地了解运行时的操作。
IntelliJ Profiler works on Windows, Linux, and macOS.
IntelliJ Profiler可以在Windows、Linux和macOS上工作。
7. Other Solid Profilers
7.其他固体剖析器
Some honorable mentions here are Java Mission Control, New Relic, and Prefix (from Stackify) – these have less market share overall, but definitely, do deserve a mention. For example, Stackify’s Prefix is an excellent lightweight profiling tool, well-suited for profiling not only Java applications but other web applications as well.
这里值得一提的是Java Mission Control、New Relic和Prefix(来自Stackify) – 这些产品的总体市场份额较小,但绝对,值得一提。例如,Stackify的Prefix是一款优秀的轻量级剖析工具,不仅适用于剖析Java应用程序,也适用于其他Web应用程序。
8. Conclusion
8.结论
In this write-up, we discussed profiling and Java Profilers. We looked at the features of each Profiler and what informs the potential choice of one over another.
在这篇报道中,我们讨论了剖析和Java剖析器。我们研究了每个剖析器的特点,以及在选择一个剖析器时,有哪些因素可以参考。
There’re many Java profilers available with some having unique characteristics. The choice of which Java profiler to use, as we’ve seen in this article, is mostly dependent on a developer’s selection of tools, the level of analysis required, and the features of the profiler.
有许多Java剖析器可用,有些具有独特的特性。正如我们在本文中所看到的,选择使用哪种Java剖析器,主要取决于开发者对工具的选择、所需的分析水平以及剖析器的特性。