1. Introduction
1.绪论
One of the many great features of Spring Boot is the set of built-in actuators. These actuators provide an easy way to monitor and control just about every aspect of a Spring Boot application.
Spring Boot 的众多优秀功能之一是一组内置的actuators。这些执行器为监视和控制Spring Boot应用程序的几乎所有方面提供了一种简单的方法。
In this tutorial, we’ll look at using the metrics actuator to create a self-hosted monitoring solution for Spring Boot applications.
在本教程中,我们将了解如何使用指标执行器来为Spring Boot应用程序创建一个自我托管的监控解决方案。
2. Metrics Database
2.度量衡数据库
The first part of monitoring Spring Boot applications is choosing a metrics database. By default, Spring Boot will configure a Micrometer metrics registry in every application.
监控Spring Boot应用程序的第一部分是选择一个度量数据库。默认情况下,Spring Boot将在每个应用程序中配置一个Micrometer指标注册表。
This default implementation collects a pre-defined set of application metrics such as memory and CPU usage, HTTP requests, and a few others. But these metrics are stored in memory only, meaning they will be lost any time the application is restarted.
这个默认实现收集了一套预先定义的应用程序指标,如内存和CPU使用率、HTTP请求和其他一些指标。但是这些指标只存储在内存中,这意味着在应用程序重新启动时,它们会丢失。
To create a self-hosted monitoring solution, we should first choose a metrics database that lives outside the Spring Boot application. The following sections will discuss just a few of the available self-hosted options.
要创建一个自我托管的监控解决方案,我们首先应该选择一个生活在Spring Boot应用程序之外的度量数据库。下面几节将讨论几个可用的自托管选项。
Note that any time Spring Boot detects another metrics database on the classpath, it automatically disables the in-memory registry.
注意,任何时候Spring Boot在classpath上检测到另一个度量衡数据库,它就会自动禁用内存中的注册表。
2.1. InfluxDB
2.1.InfluxDB
InfluxDB is an open-source time-series database. The quickest way to get started with InfluxDB is to run it locally as a Docker container:
InfluxDB是一个开源的时间序列数据库。开始使用InfluxDB的最快方法是将其作为一个Docker容器在本地运行。
docker run -p 8086:8086 -v /tmp:/var/lib/influxdb influxdbNote that this will store metrics in the local /tmp partition. This is fine for development and testing, but would not be a good choice for production environments.
注意,这将在本地/tmp分区中存储指标。这对开发和测试来说很好,但对生产环境来说不是一个好的选择。
Once InfluxDB is running, we can configure our Spring Boot application to publish metrics to it by adding the appropriate Micrometer dependency:
一旦InfluxDB运行,我们可以通过添加适当的Micrometer依赖性来配置我们的Spring Boot应用程序,以便向它发布指标。
<dependency>
    <groupId>io.micrometer</groupId>
    <artifactId>micrometer-registry-influx</artifactId>
</dependency>
Additionally, we need to add a new entry to the application.properties file:
此外,我们需要在application.properties文件中添加一个新条目。
management.metrics.export.influx.uri=http://localhost:8086Out of the box, the database name is set to mydb, whereas the username and password remain unset.
开箱后,数据库名称被设置为mydb,而用户名和密码仍未设置。
However, we can override the default values using dedicated properties:
然而,我们可以使用专用属性覆盖默认值。
management.metrics.export.influx.db=customDbName
management.metrics.export.influx.user-name=myUserName
management.metrics.export.influx.password=mySecret
InfluxDB does not provide a native visualization tool. However, it provides a separate tool called Chronograph that works well for visualizing InfluxDB data.
InfluxDB不提供本地可视化工具。但是,它提供了一个名为Chronograph的单独工具,该工具在可视化InfluxDB数据方面效果良好。
2.2. Prometheus
2.2. 普罗米修斯
Prometheus is an open-source monitoring and alerting toolkit originally built at SoundCloud. It works slightly differently from InfluxDB.
Prometheus是一个开源的监控和警报工具包,最初由SoundCloud建立。它的工作方式与InfluxDB略有不同。
Instead of configuring our application to publish metrics to Prometheus, we configure Prometheus to poll our application periodically.
我们没有配置我们的应用程序向普罗米修斯发布指标,而是配置普罗米修斯定期轮询我们的应用程序。
First, we configure our Spring Boot application to expose a new Prometheus actuator endpoint. We do this by including the micrometer-registry-prometheus dependency:
首先,我们要配置我们的Spring Boot应用程序,以暴露一个新的Prometheus执行器端点。我们通过包括micrometer-registry-prometheus依赖关系来做到这一点。
<dependency>
    <groupId>io.micrometer</groupId>
    <artifactId>micrometer-registry-prometheus</artifactId>
</dependency>
This will create a new actuator endpoint that produces metrics data in a special format that Prometheus understands.
这将创建一个新的执行器端点,以普罗米修斯理解的特殊格式产生指标数据。
Next, we have to configure Prometheus to poll our application by adding our desired configuration into a prometheus.yml file.
接下来,我们必须配置Prometheus来轮询我们的应用程序,把我们想要的配置添加到prometheus.yml文件中。
The following configuration instructs Prometheus to poll our application every 5 seconds, using the new actuator endpoint:
下面的配置指示Prometheus每5秒轮询一次我们的应用程序,使用新的执行器端点。
scrape_configs:
  - job_name: 'spring-actuator'
    metrics_path: '/actuator/prometheus'
    scrape_interval: 5s
    static_configs:
    - targets: ['127.0.0.1:8080']
Finally, we can start a local Prometheus server using Docker. This assumes our custom config file is located in the local file /etc/prometheus/prometheus.yml:
最后,我们可以使用Docker启动本地的Prometheus服务器。这假定我们的自定义配置文件位于本地文件/etc/prometheus/prometheus.yml中。
docker run -d \
--name=prometheus \
-p 9090:9090 \
-v /etc/prometheus/prometheus.yml:/etc/prometheus/prometheus.yml \
prom/prometheus \
--config.file=/etc/prometheus/prometheus.yml
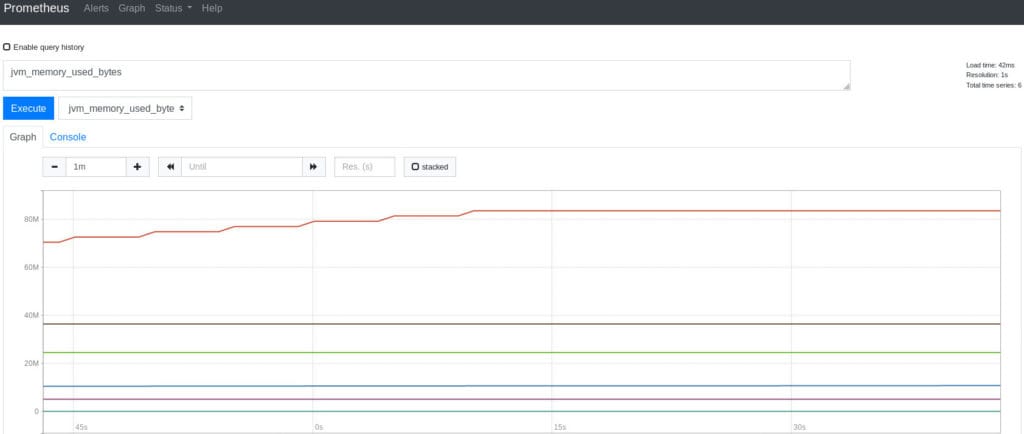
Prometheus provides its own visualization tool for viewing metrics that is has collected. It can be accessed at the URL http://localhost:9090/.
普罗米修斯提供自己的可视化工具,用于查看所收集的指标。它可以通过以下网址访问:http://localhost:9090/.。
2.3. Graphite
2.3 石墨
Graphite is another open-source time-series database. Its architecture is slightly more complicated than the other databases we’ve looked at, but with Docker, it’s straightforward to run an instance locally:
Graphite是另一个开源的时间序列数据库。它的架构比我们看过的其他数据库略微复杂一些,但是通过Docker,在本地运行一个实例是很简单的。
docker run -d \
 --name graphite \
 --restart=always \
 -p 80:80 \
 -p 2003-2004:2003-2004 \
 -p 2023-2024:2023-2024 \
 -p 8125:8125/udp \
 -p 8126:8126 \
 graphiteapp/graphite-statsd
Then we can configure Spring Boot to publish metrics to our instance by adding the micrometer-registry-graphite dependency:
然后,我们可以通过添加micrometer-registry-graphite依赖项来配置Spring Boot,以便将指标发布到我们的实例。
<dependency>
    <groupId>io.micrometer</groupId>
    <artifactId>micrometer-registry-graphite</artifactId>
</dependency>
As well as adding the configuration properties to application.properties:
以及将配置属性添加到application.properties。
management.metrics.export.graphite.host=127.0.0.1
management.metrics.export.graphite.port=2004
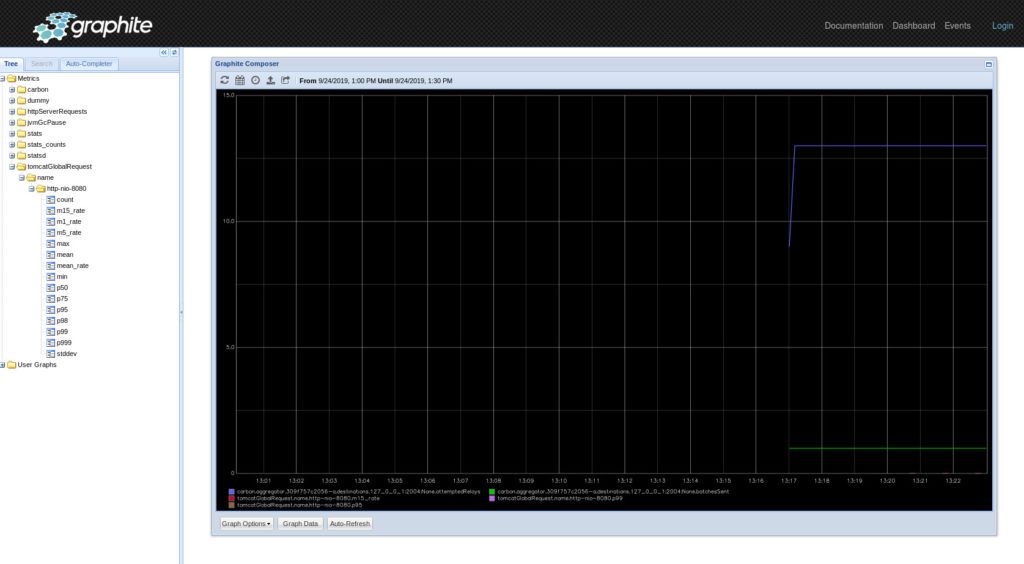
Like Prometheus, Graphite includes its own visualization dashboard. It is available at the URL http://localhost/.
与Prometheus一样,Graphite包括它自己的可视化仪表板。它可以在http://localhost/的网址上找到。
3. Visualization Tools
3.可视化工具
Once we have a solution for storing metrics outside of our Spring Boot application, the next decision is how we want to visualize the data.
一旦我们有了在Spring Boot应用程序之外存储指标的解决方案,下一个决定是我们要如何将数据可视化。
Some of the metrics databases mentioned previously include their own visualization tools. There is a stand-alone visualization tool that is worth looking at for our self-hosted monitoring solution.
之前提到的一些指标数据库包括他们自己的可视化工具。有一个独立的可视化工具,对于我们的自我托管监控解决方案来说,值得一看。
3.1. Grafana
3.1. Grafana
Grafana is an open-source analytics and monitoring tool. It can connect to all of the previously mentioned databases, as well as many others.
Grafana是一个开源的分析和监控工具。它可以连接到前面提到的所有数据库,以及许多其他数据库。
Grafana generally provides better configuration and superior alerting than most built-in visualization tools. It can easily be extended using plugins, and there are lots of pre-built dashboards that can be imported to quickly create our own visualizations.
与大多数内置的可视化工具相比,Grafana通常提供更好的配置和卓越的警报功能。它可以很容易地使用插件进行扩展,而且有很多预建的仪表盘可以导入,以快速创建我们自己的可视化。
To run Grafana locally, we can start it using Docker:
要在本地运行Grafana,我们可以使用Docker启动它。
docker run -d -p 3000:3000 grafana/grafanaWe can now access the Grafana home page at the URL http://localhost:3000/.
我们现在可以通过http://localhost:3000/的URL访问Grafana主页。
At this point, we would need to configure one or more data sources. This can be any of the metrics databases discussed previously or a variety of other supported tools.
在这一点上,我们将需要配置一个或多个数据源。这可以是之前讨论过的任何一个指标数据库或其他各种支持的工具。
Once a data source is configured, we can build a new dashboard or import one that does what we want.
一旦配置好了数据源,我们就可以建立一个新的仪表盘,或者导入一个能满足我们需求的仪表盘。
4. Conclusion
4.总结
In this article, we have looked at creating a self-hosted monitoring solution for Spring Boot applications.
在这篇文章中,我们研究了为Spring Boot应用程序创建一个自我托管的监控解决方案。
We looked at three metrics databases that Spring Boot readily supports and saw how to run them locally.
我们看了Spring Boot随时支持的三个度量衡数据库,并看了如何在本地运行它们。
We also looked briefly at Grafana, a powerful visualization tool that can display metrics data from a variety of sources.
我们还简单看了一下Grafana,这是一个强大的可视化工具,可以显示来自各种来源的指标数据。


