1. Overview
1.概述
Performance testing is a crucial part of software development. It helps reveal bottlenecks and bugs and ensures our applications are responsive. One particularly important aspect is the time a web application needs to load and react to user interactions.
性能测试是软件开发的一个关键部分。它有助于揭示瓶颈和错误,并确保我们的应用程序是反应灵敏的。一个特别重要的方面是网络应用程序需要加载和对用户互动作出反应的时间。
In this article, we’re going to explore two metrics that can help detect and improve load time issues: latency and load time. We’ll learn how these metrics are defined, what distinguishes them from each other, and how to measure them with the performance tool JMeter.
在本文中,我们将探讨两个可以帮助检测和改进加载时间问题的指标。延迟和加载时间。我们将了解这些指标是如何定义的,它们之间的区别是什么,以及如何使用性能工具JMeter测量它们。
2. Latency and Load Time Metrics in JMeter
2.JMeter中的延迟和加载时间指标
In JMeter, latency and load time are both metrics that measure roundtrips. In other words, they both measure the time from when a client sends a request to a server until it receives the response. However, there’s an important difference between these two.
在JMeter中,latency和load time都是测量roundtrips的指标。换句话说,它们都是测量从客户端向服务器发送请求直到收到响应的时间。然而,这两者之间有一个重要的区别。
Latency is defined as the time from just before sending the request to just after receiving the first part of the response, whereas load time is the time from just before sending the request to just after receiving the last part of the response.
延迟被定义为从刚刚发送请求到刚刚收到响应的第一部分的时间,而加载时间是指从刚刚发送请求到刚刚收到响应的最后一部分的时间。
For both metrics, JMeter includes the time it takes to assemble the request. Latency also includes the time it takes to assemble the first part of the response, and load time includes the time to assemble the entire response. Assembling does not include the rendering of the response or any client-side code execution.
对于这两个指标,JMeter包括组装请求的时间。延迟还包括组装响应的第一部分所需的时间,而加载时间包括组装整个响应的时间。组装不包括响应的渲染或任何客户端代码的执行。
3. How to Measure Latency and Load Time
3.如何测量延时和加载时间
We can measure latency and load time in JMeter by creating a test plan that sends an HTTP request and uses a View Results Tree Listener.
我们可以在JMeter中测量延迟和加载时间,方法是创建一个测试计划,发送一个HTTP请求并使用查看结果树监听器。
We’ll start with a test plan that JMeter automatically creates when we open the tool. In our case, let’s rename it to LatencyVsLoadTime:
我们将从JMeter打开工具时自动创建的测试计划开始。在我们的例子中,让我们把它重命名为LatencyVsLoadTime。
Next, let’s create a Thread Group, which is the beginning point of every test plan. This is done by right-clicking the test plan and then selecting Add -> Thread (Users) -> Thread Group:
接下来,让我们创建一个线程组,它是每个测试计划的起始点。这是通过右键单击测试计划,然后选择添加-> 线程(用户)-> 线程组。
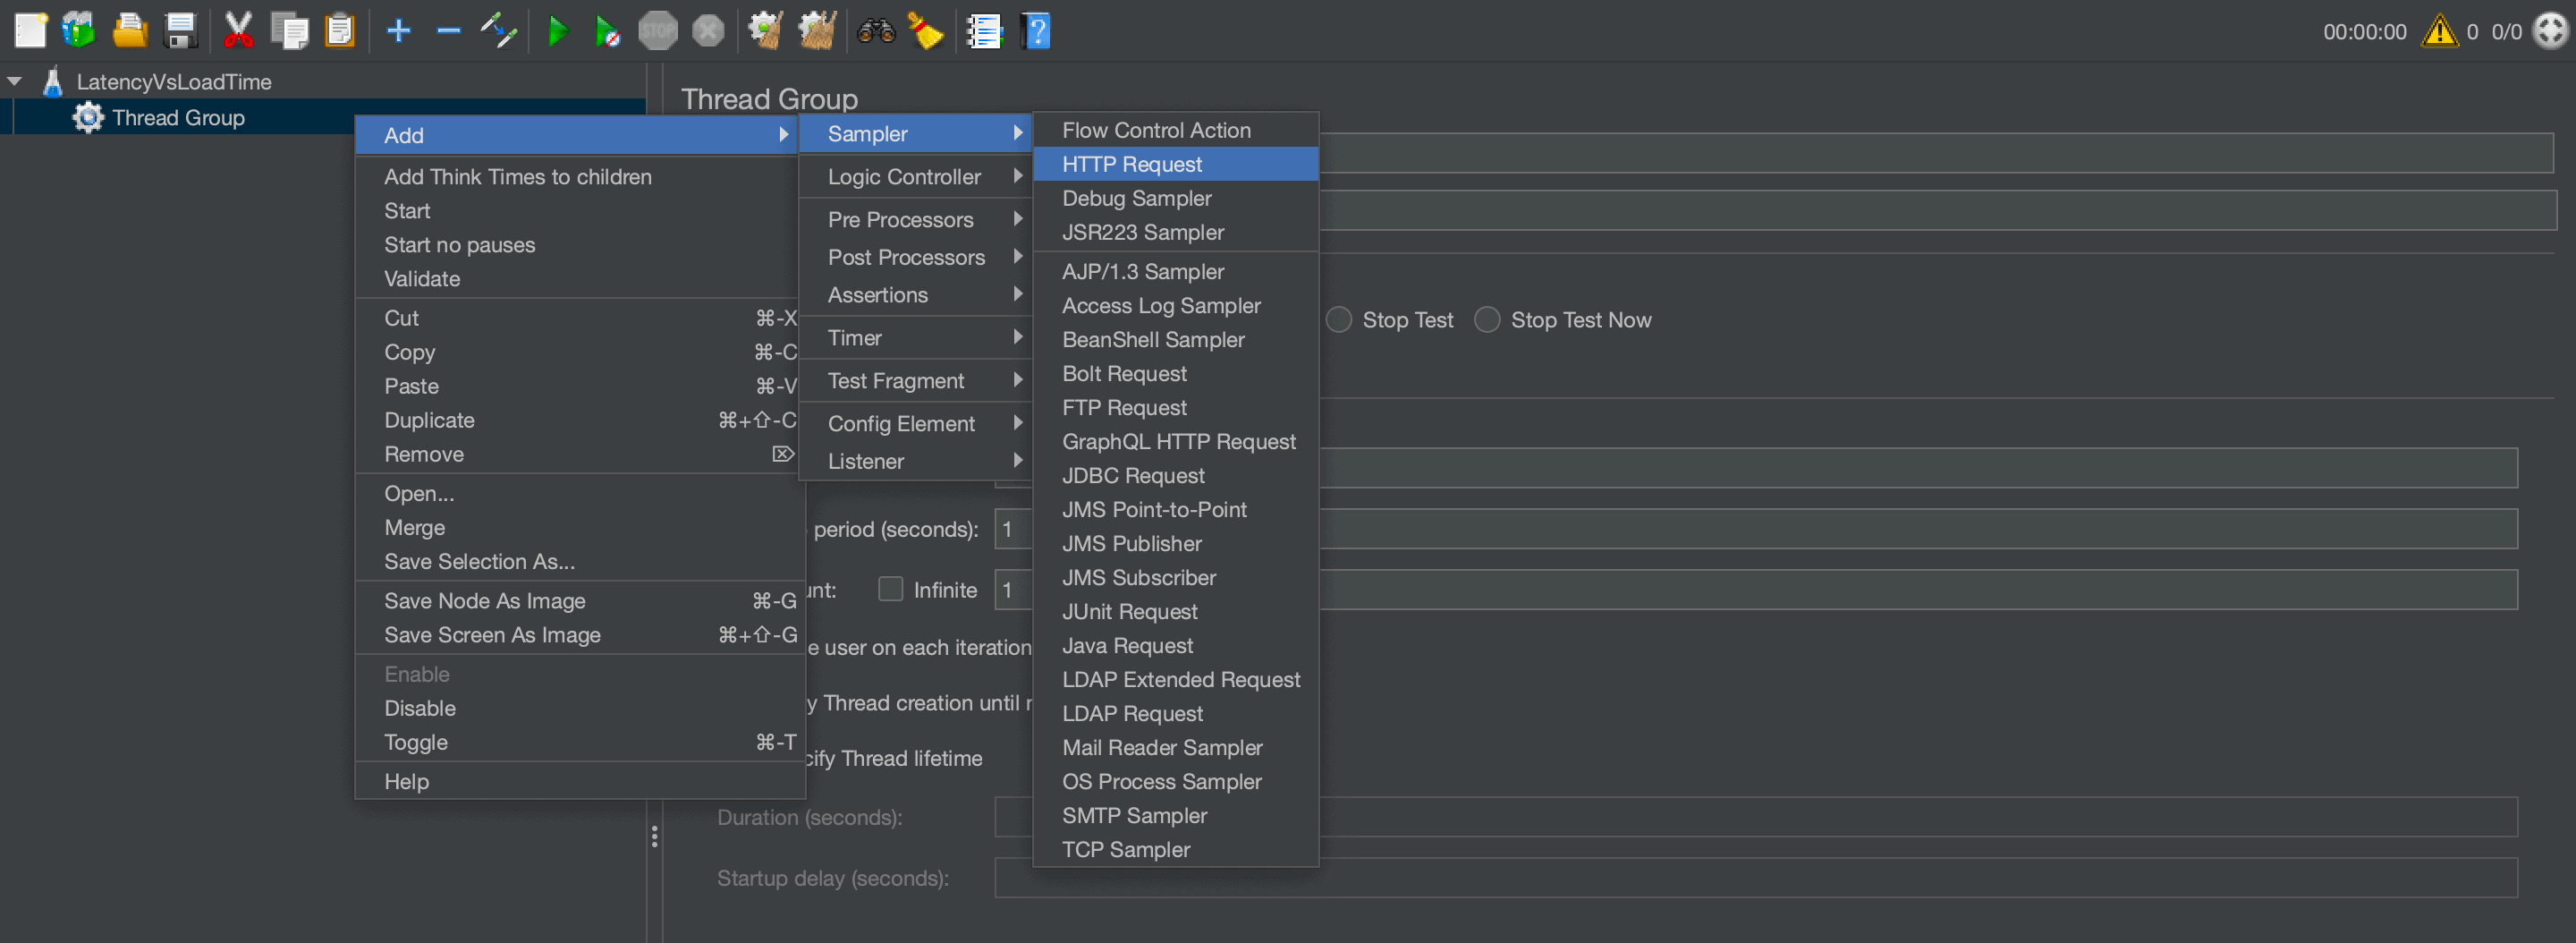
Next, let’s add an HTTP Request by right-clicking the Thread Group and selecting Add -> Sampler -> HTTP Request:
接下来,让我们通过右击线程组并选择添加->采样器->HTTP请求来添加一个HTTP请求。
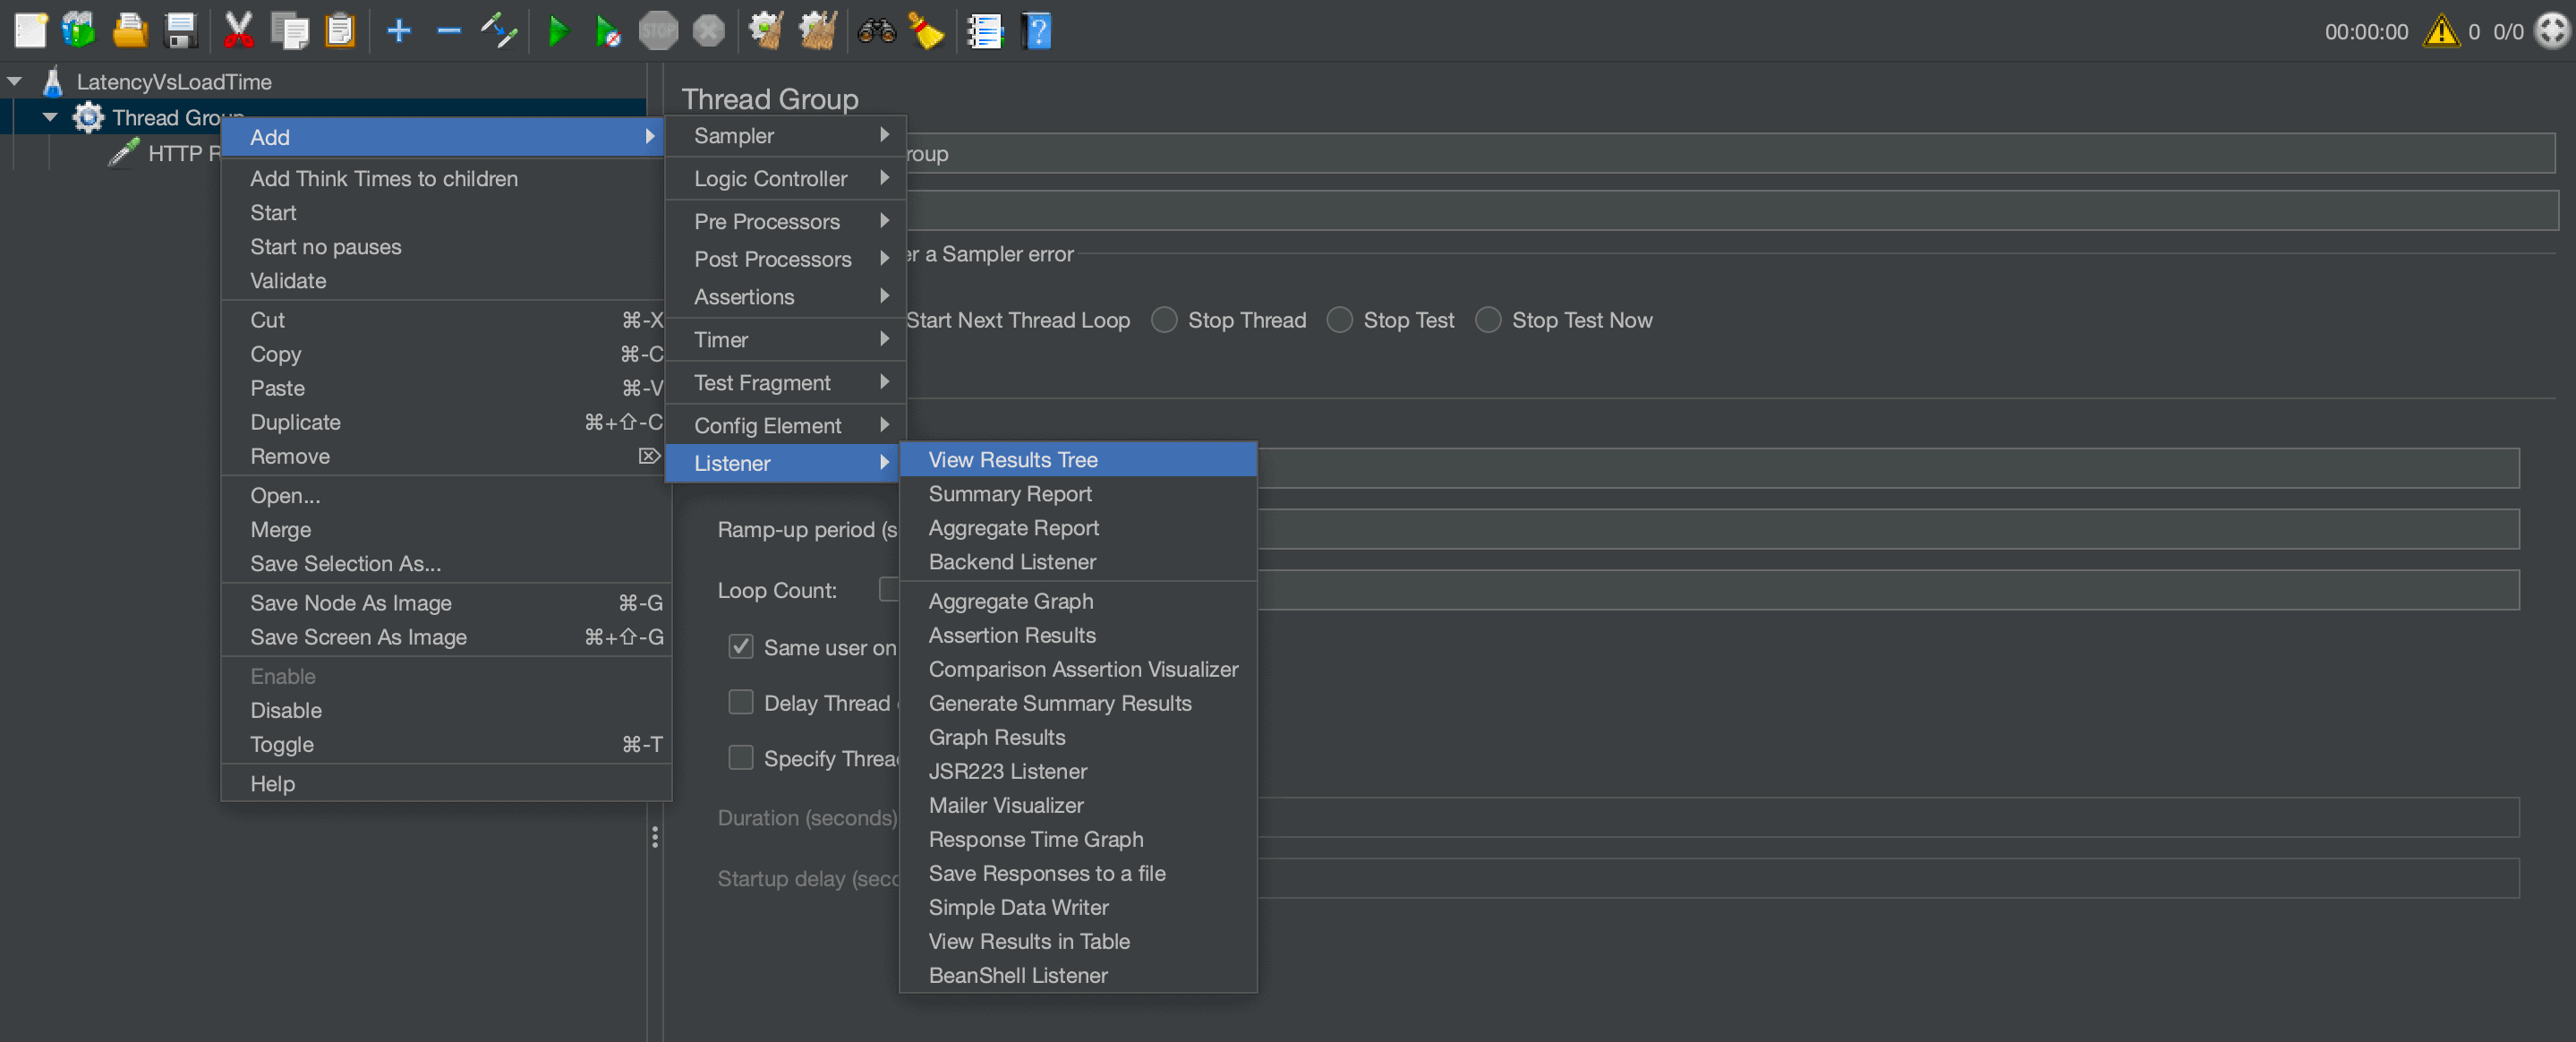
Last but not least, we need a Listener that tracks the results of our request. Let’s add it by right-clicking the Thread Group and selecting Add -> Listener -> View Results Tree:
最后但并非最不重要的是,我们需要一个Listener来跟踪我们的请求结果。让我们通过右击线程组并选择添加-> 监听器-> 查看结果树来添加它。
Now that we have all parts of the test plan in place, let’s configure our HTTP request.
现在我们已经有了测试计划的所有部分,让我们来配置我们的HTTP请求。
To do this, we select the HTTP Request and set the Path to the URL we want to test. For our example, let’s choose https://www.google.com:
要做到这一点,我们选择HTTP请求,并将路径设置为我们要测试的URL。对于我们的例子,让我们选择https://www.google.com。
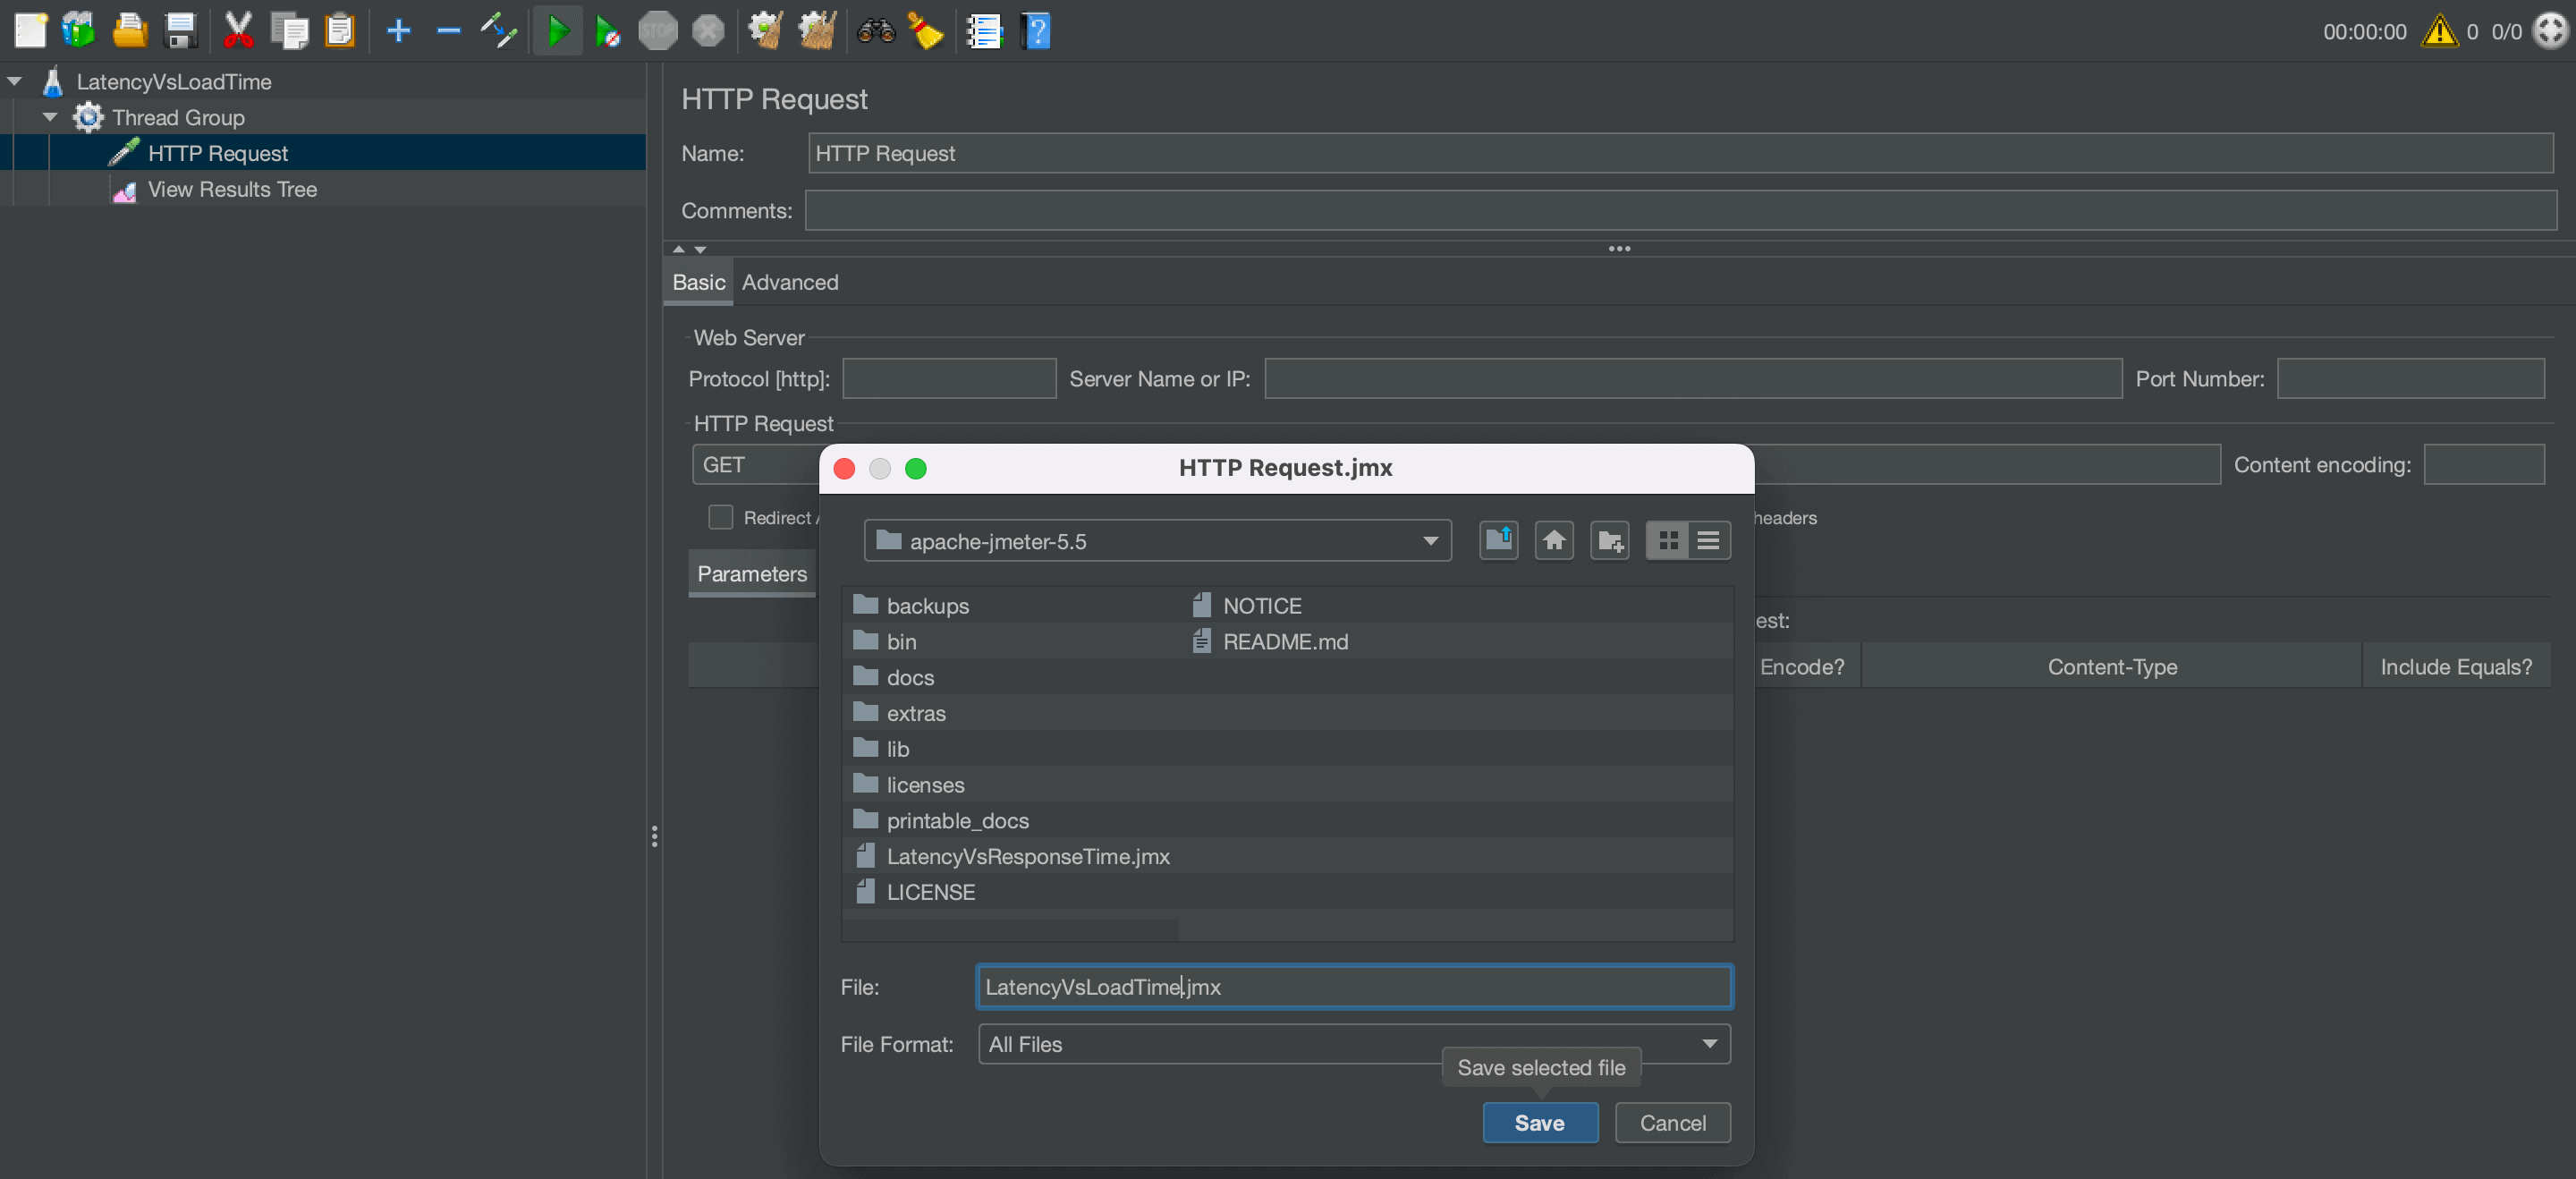
After saving the test plan by clicking the disk icon in the top bar, we can execute it. Let’s select the HTTP Request and click the play button in the top bar:
点击顶部栏的磁盘图标保存测试计划后,我们可以执行它。让我们选择HTTP请求并点击顶部栏的播放按钮。
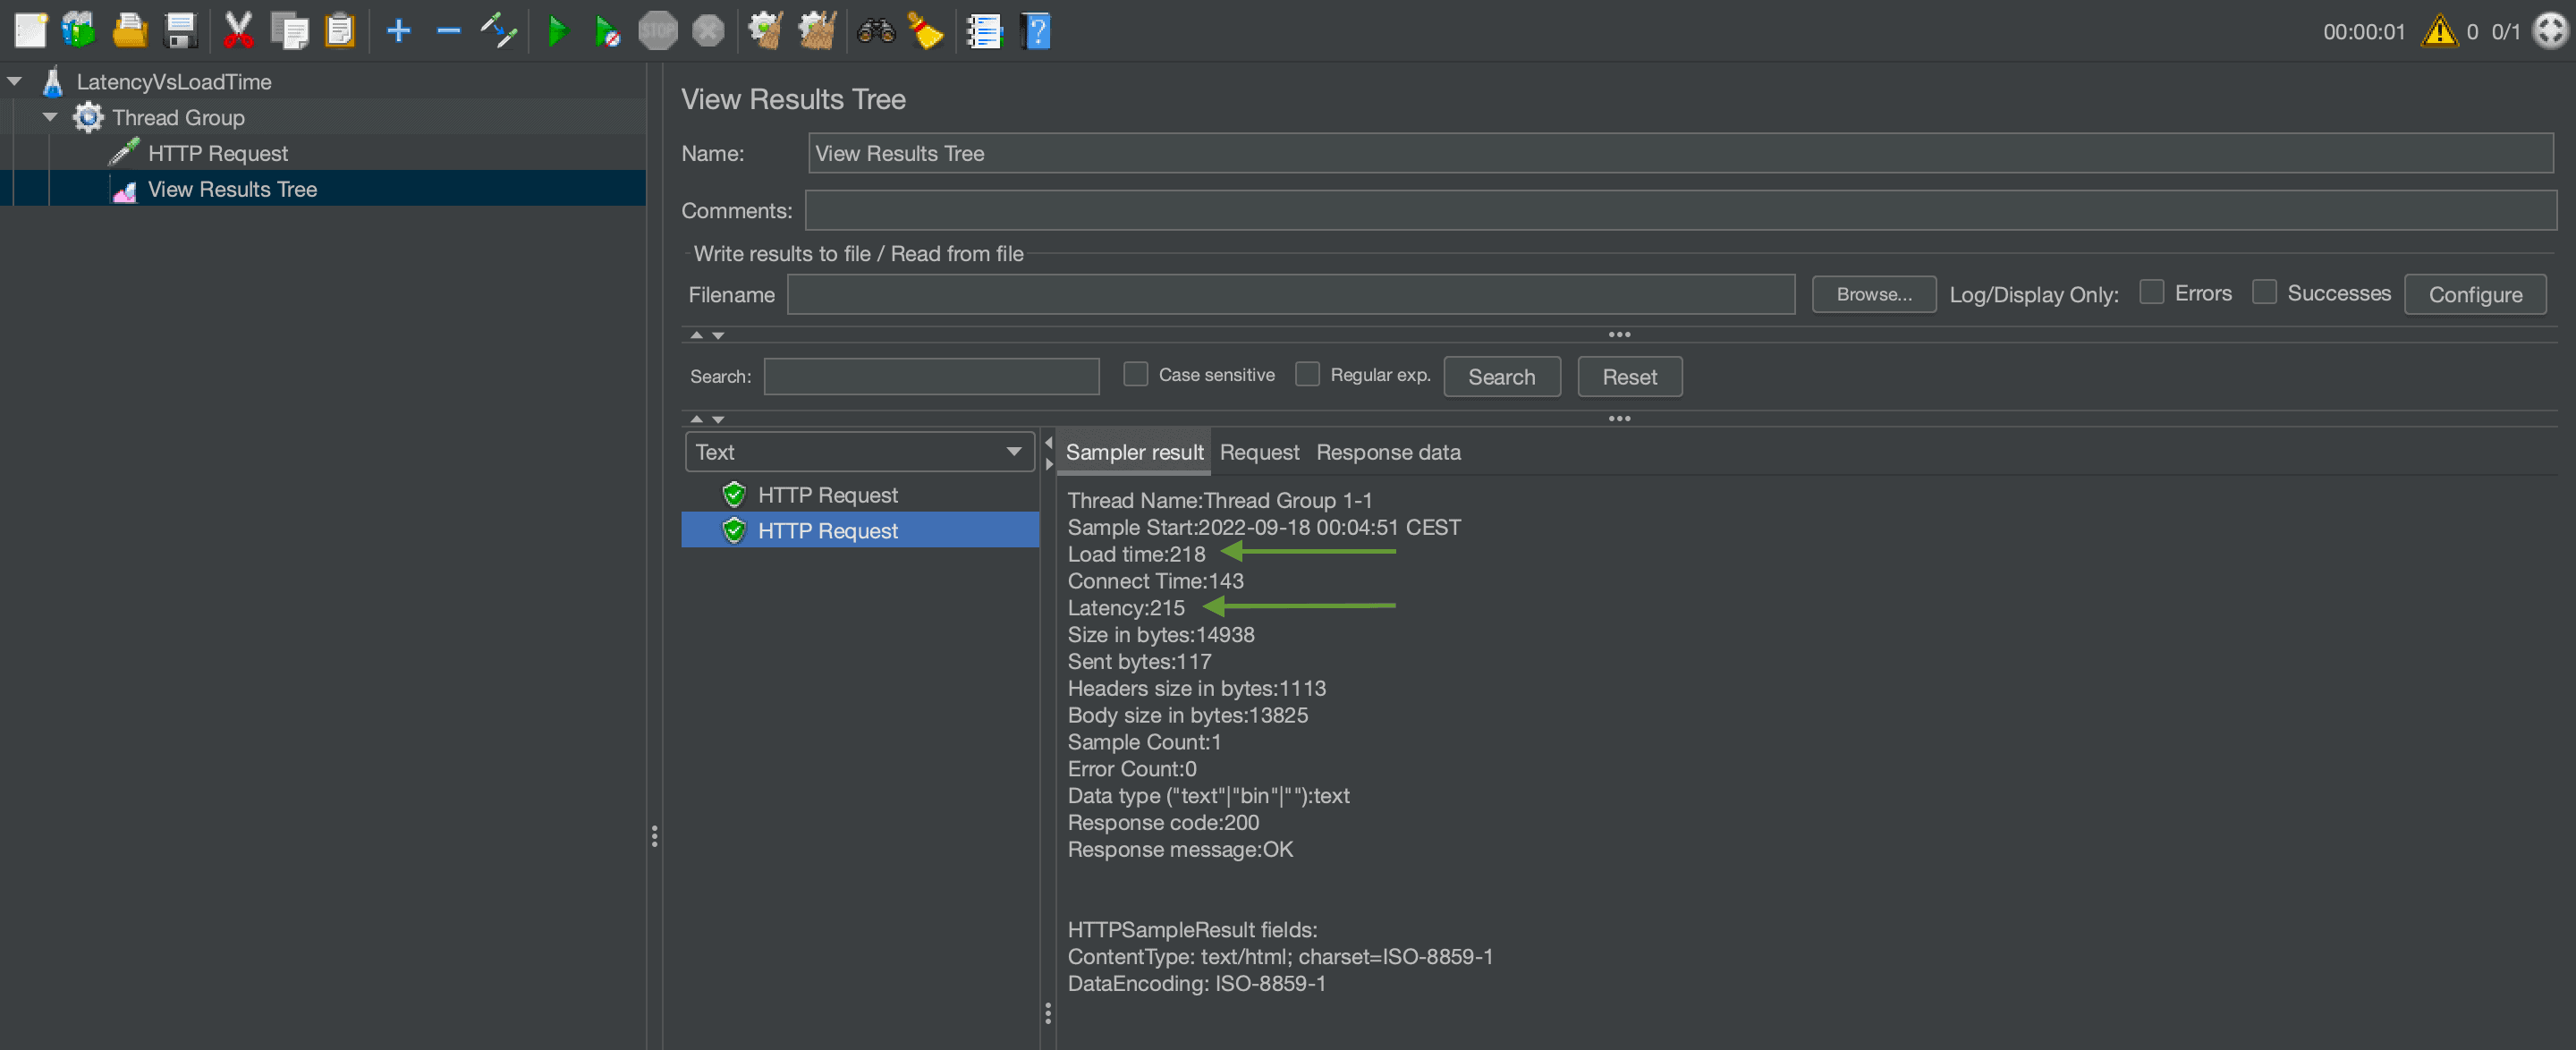
Finally, let’s check the results by selecting the View Results Tree element under the Sampler result tab. In our example, the request has a latency of 215 ms and a load time of 218 ms:
最后,让我们通过选择Sampler result标签下的View Results Tree元素检查结果。在我们的例子中,请求的延迟为215ms,加载时间为218ms。
4. Conclusion
4.总结
In this article, we’ve discussed two performance metrics, latency and load time, that can help to detect load time issues and improve the usability of an application.
在这篇文章中,我们讨论了两个性能指标,延迟和加载时间,它们可以帮助检测加载时间问题并改善应用程序的可用性。
First, we defined the metrics in the context of JMeter and elaborated on the difference between the two. Then, we saw how to set up a JMeter test plan with an HTTP request that we could use to measure the metrics. Finally, we learned how to execute the test plan and examine the results.
首先,我们在JMeter的背景下定义了指标,并阐述了两者的区别。然后,我们看到如何用一个HTTP请求来设置JMeter测试计划,我们可以用它来测量指标。最后,我们学习了如何执行测试计划和检查结果。
The JMeter test plan that we created throughout this article is available over on GitHub.
我们在本文中创建的JMeter测试计划可在GitHub上获得。


