1. Introduction
1.介绍
In our previous article, we introduced Lightrun – a Developer Observability platform. In this article, we’re going to look deeper into the features that it offers, how we can best use them with our applications, and what we can get from it.
在我们的前一篇文章中,我们介绍了Lightrun–一个开发者观察平台。在这篇文章中,我们将深入了解它所提供的功能,我们如何在我们的应用程序中最好地使用它们,以及我们可以从中获得什么。
2. Snapshots
2.快照
In our last article, we briefly examined what snapshots are and what they can do for us. Here, we’re going to look in more depth at what they are, how we can best use them, and what they can do for us.
在上一篇文章中,我们简要地研究了什么是snapshots以及它们可以为我们做什么。在这里,我们将更深入地研究它们是什么,我们如何才能最好地使用它们,以及它们能为我们做什么。
Snapshots are similar to debugger breakpoints. We can register a snapshot on any line of code in our application. Every time it’s triggered it will automatically record the full stack trace and the value of every visible variable. Just like normal breakpoints, this will include local variables, method parameters, and class fields, and will do so up the entire stack frame.
快照类似于调试器断点。我们可以在应用程序的任何一行代码上注册一个快照。每次它被触发时,都会自动记录完整的堆栈跟踪和每个可见变量的值。就像正常的断点一样,这将包括局部变量、方法参数和类字段,并将在整个堆栈帧中进行记录。
The main difference between snapshots and debugger breakpoints is that snapshots are non-intrusive. They do not cause anything to block – be it the entire application or just the executing thread. They record the current state of execution, and the application carries on without interrupting the application in any way.
快照和调试器断点的主要区别是,快照是非侵入性的。它们不会导致任何东西阻塞–无论是整个应用程序还是仅仅是执行中的线程。它们记录当前的执行状态,而应用程序则继续进行,不会以任何方式中断应用程序。
Traditional blocking breakpoints such as in a debugger would cause either the single thread or else the entire application to stop pause whilst we are looking at the details. Lightrun allows us to do all of this without affecting the live application at all.
传统的阻断点,如调试器中的阻断点,会导致单个线程或整个应用程序停止暂停,而我们正在查看细节。Lightrun允许我们在不影响实时应用程序的情况下完成所有这些工作。
2.1. Placing Snapshots
2.1.放置快照
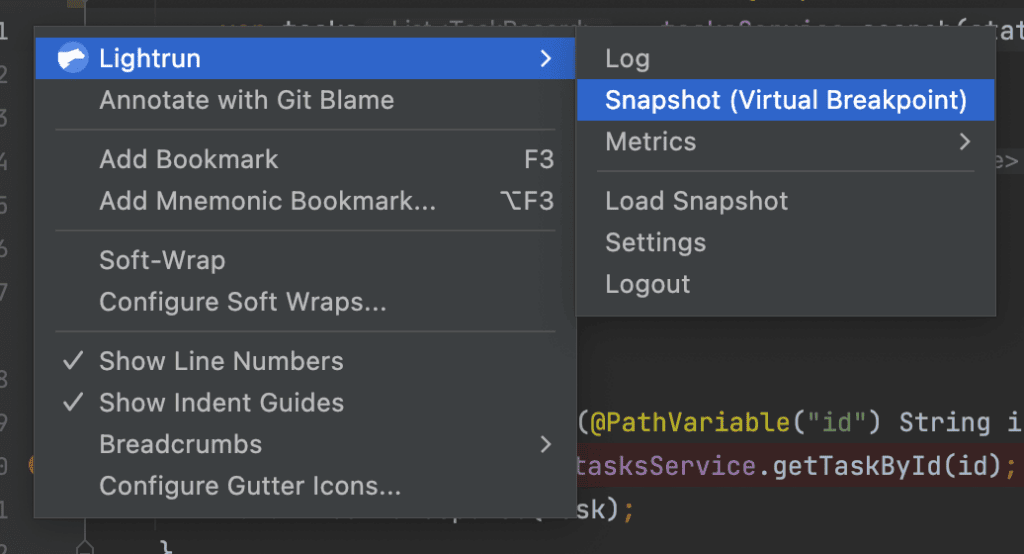
Snapshots are placed into our application directly from our code editor. In this article, we are using IntelliJ IDEA, but everything can also be achieved from Visual Studio Code as well. We need to determine where in the application we want to place a snapshot. We can then right-click on this line of code and select “Lightrun > Snapshot (Virtual Breakpoint)” from the menu:
快照是直接从我们的代码编辑器放置到我们的应用程序中的。在本文中,我们使用的是IntelliJ IDEA,但一切也可以从Visual Studio Code中实现。我们需要确定在应用程序中我们想要放置快照的位置。然后,我们可以右击这行代码,从菜单中选择 “Lightrun > Snapshot (Virtual Breakpoint)”。
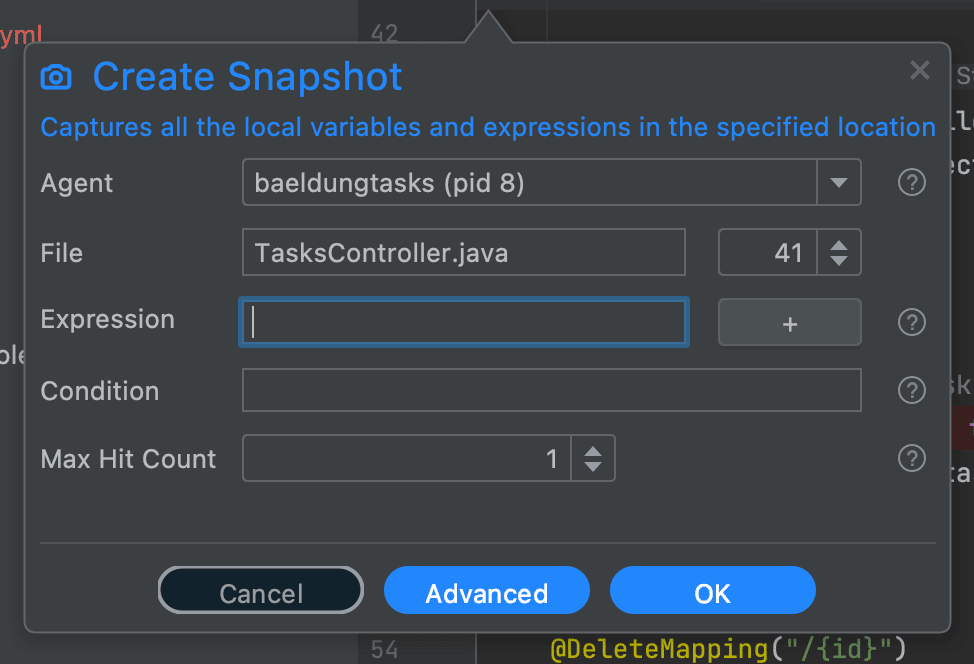
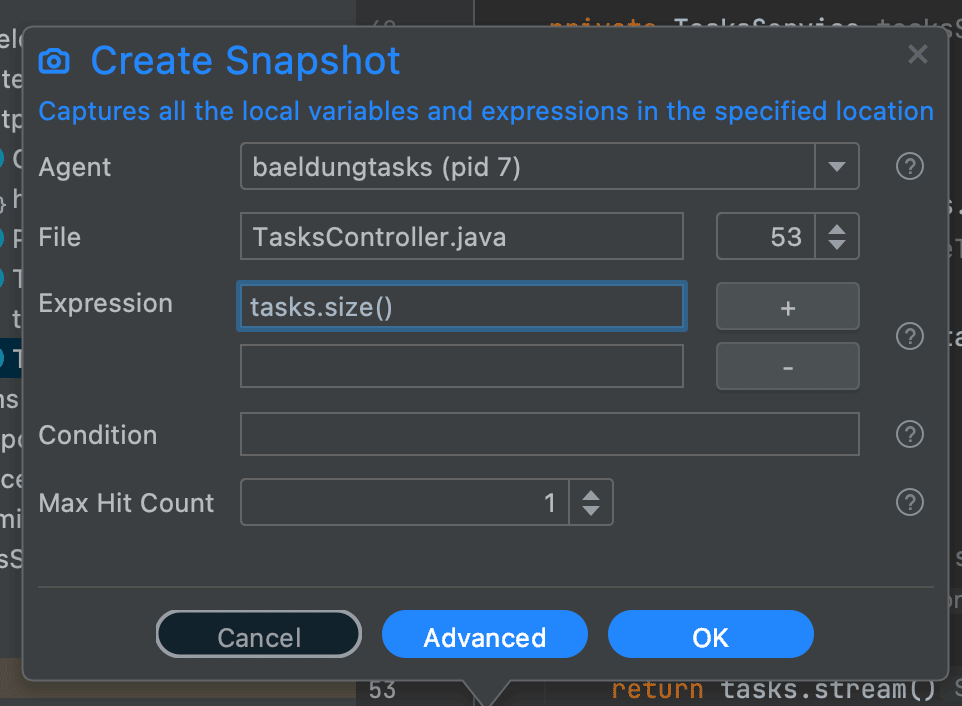
Doing this will then open a dialog allowing us to specify the details of the snapshot:
这样做将打开一个对话框,允许我们指定快照的细节。
The default behavior of this is relatively simple but often this is what is most useful. It will:
这的默认行为相对简单,但往往这才是最有用的。它将。
- Take a snapshot of the exact line selected.
- With no conditions on when to trigger the snapshot.
- With no extra expressions to record with the snapshot.
- Recording only the first time the snapshot is triggered.
- Expiring one hour after it was added.
This means that it will record the exact state of execution the next time this line of code is executed, as long as it was within the next hour. When we’re diagnosing an issue this is often the most useful setup, because we want to be in control of what is recorded without getting any noise in the recordings. We’ll see more about all of these later in the article.
这意味着,只要是在接下来的一个小时内,它就会记录下这一行代码在下一次执行时的准确状态。当我们诊断一个问题时,这往往是最有用的设置,因为我们想控制记录的内容,而不在记录中得到任何噪音。我们将在文章后面看到更多关于所有这些的内容。
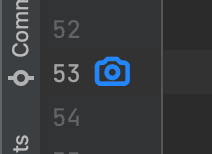
Once we have done this, a blue camera icon is placed next to the line of code that the snapshot is registered for. This indicates that our snapshot has been successfully placed and will record when triggered:
一旦我们完成了这些工作,一个蓝色的相机图标就会放在快照注册的代码行旁边。这表明我们的快照已被成功放置,并将在触发时进行记录。
When the snapshot gets triggered, we’ll automatically have the details available to see in our editor. This looks and functions almost exactly the same as the IntelliJ breakpoint panel, because it is designed to serve the same purpose:
当快照被触发时,我们将自动在编辑器中看到细节。这看起来和功能几乎与IntelliJ的断点面板完全一样,因为它的设计目的是一样的。
Here we can immediately see the full stack trace to our execution, and the variables that we could access. This includes the variable this, inside of which we can see the fields of the current class instance. We can also drill into these as far as we want, and click into other methods in the stack frame, in the exact same way as with a traditional debugger.
在这里我们可以立即看到我们执行的全部堆栈跟踪,以及我们可以访问的变量。这包括变量this,在这个变量中我们可以看到当前类实例的字段。我们还可以尽情地钻研这些,并点击堆栈框架中的其他方法,与传统调试器的方式完全相同。
2.2. Conditional Snapshots
2.2.条件性快照
In some scenarios, we want to record our snapshots only when certain conditions are met. For example, only when the current user is a particular username.
在某些情况下,我们希望仅在满足某些条件时记录我们的快照。例如,仅当当前用户是某个特定的用户名时。
Lightrun snapshots allow us to specify a condition as part of setting them up. This is very similar to the way conditional breakpoints work in our debugger. Our condition is specified as a Java expression that evaluates to either true or false. This can access anything that would be visible at the point the snapshot is triggered, meaning any local variables, parameters, class fields, or anything else.
Lightrun快照允许我们指定一个条件作为设置它们的一部分。这与调试器中的条件断点工作方式非常相似。我们的条件被指定为一个Java表达式,评价为true或false。这可以访问任何在触发快照时可见的东西,即任何局部变量、参数、类字段或其他东西。
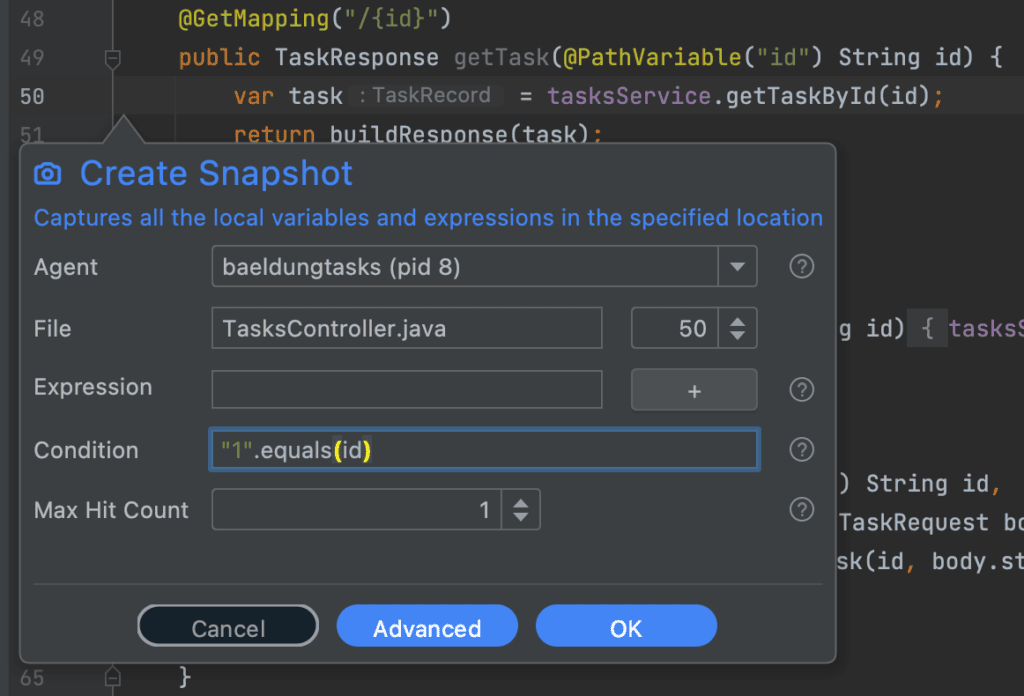
For example, imagine we have a method with a parameter id. We want to record a snapshot when this is called, but only when the ID provided is a particular value. We can set this up with a condition triggered exactly as desired:
例如,设想我们有一个带参数id的方法。我们想在这个方法被调用时记录一个快照,但只有当提供的ID是一个特定的值时。我们可以用一个触发的条件来设置这一点,完全按照我们的要求。
This means that the snapshot will only be triggered when called with our particular test value, but any other live usage of the service will be ignored unless they happen to use the same value. This helps ensure that what we see in our snapshots pane is exactly what we want, without any extra noise cluttering it up and making our diagnosis harder.
这意味着快照只有在用我们的特定测试值调用时才会被触发,但该服务的任何其他实时使用情况都会被忽略,除非它们碰巧使用相同的值。这有助于确保我们在快照窗格中看到的正是我们想要的,没有任何额外的噪音干扰,使我们的诊断更加困难。
2.3. Additional Expressions
2.3.附加表达式
In some situations, we may have additional values that we want to record as part of a snapshot.
在某些情况下,我们可能有额外的值要记录为快照的一部分。
These might be computations from other values just to make life easier – for example, drilling into nested values to surface them easier. These might also be calls to get values that otherwise wouldn’t be recorded – for example, from static variables such as RequestContextHolder or SecurityContextHolder. They can even be method calls on any of the values that we can see, and record the result of these methods.
这些可能是来自其他值的计算,只是为了使生活更容易–例如,钻进嵌套的值,以便更容易地浮现它们。这些也可能是为获得否则不会被记录的值而进行的调用–例如,从静态变量,如RequestContextHolder或SecurityContextHolder。它们甚至可以是对我们可以看到的任何值的方法调用,并记录这些方法的结果。
Expressions are added in a very similar way to conditions, by entering the expression to be recorded into the Snapshot dialog:
表达式的添加方式与条件非常相似,在快照对话框中输入要记录的表达式。
We can add as many expressions as needed to a single snapshot, and all of them will be calculated and recorded whenever the snapshot is triggered.
我们可以根据需要在一个快照中添加尽可能多的表达式,只要快照被触发,所有的表达式都会被计算和记录。
These values then appear in the recorded snapshot as part of the “Variables” pane, with a different icon to indicate that they were manually added expressions instead of automatically detected variables:
然后,这些值作为 “变量 “窗格的一部分出现在记录的快照中,用不同的图标表示它们是手动添加的表达式,而不是自动检测的变量。
2.4. Recording Multiple Snapshots
2.4.录制多张快照
In some situations, we might want to record multiple snapshots from the same place. For example, we might want to run several slightly different requests through the system and be able to compare the snapshots for them to identify the differences.
在某些情况下,我们可能想从同一个地方记录多个快照。例如,我们可能想通过系统运行几个略有不同的请求,并能够比较它们的快照,以确定差异。
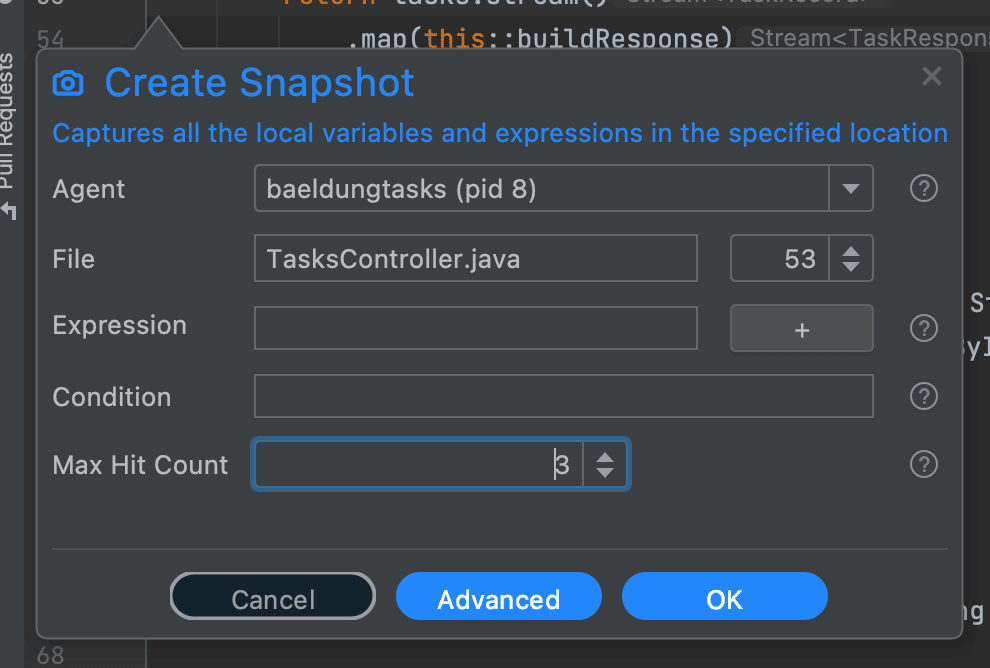
Lightrun Snapshots will by default only record a single snapshot, but we can configure it to instead record as many as we want by entering a maximum hit count into the Snapshot dialog:
Lightrun快照在默认情况下只记录一个快照,但我们可以通过在快照对话框中输入最大命中数,将其配置为记录我们想要的数量。
Doing this will then record snapshots for this number of executions, and make them available to us in our editor:
这样做将记录这个数量的执行的快照,并在我们的编辑器中提供给我们。
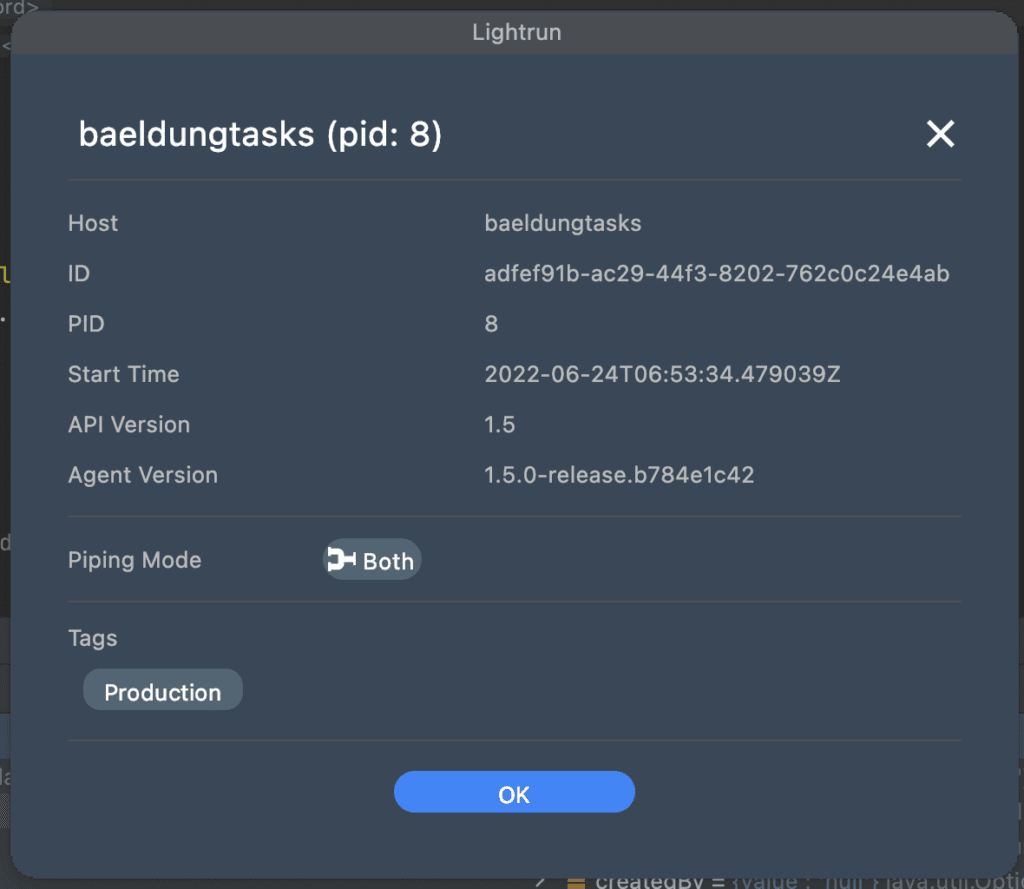
Now that we have multiple snapshots to work with, we need to know which ones are which. By clicking on the “i” icon to the side of the “Snapshot” tabs we get an information dialog about this exact snapshot:
现在我们有多个快照可以使用,我们需要知道哪个是哪个。通过点击 “快照 “标签边上的 “i “图标,我们得到一个关于这个确切快照的信息对话框。
Here we can see the server instance that the snapshot was recorded from and the time that it was recorded. We can now record as many snapshots as we need and determine which ones are which so that we can better diagnose what’s going on.
在这里我们可以看到记录快照的服务器实例和记录的时间。现在我们可以根据需要记录任意多的快照,并确定哪些是快照,这样我们就可以更好地诊断出发生了什么。
2.5. Automatically Expiring Snapshots
2.5.自动到期的快照
Recording snapshots does have a small performance cost on our application. They also cause data transfer from our application to the Lightrun servers, which can potentially incur costs. This means that whilst snapshots are immensely useful for diagnosing issues, we want to ensure that they don’t hang around longer than they’re needed. Lightrun solves this for us by automatically expiring snapshots so that they only impact our application for our exact needs and no more.
记录快照确实对我们的应用程序有一个小的性能成本。它们也会导致数据从我们的应用程序转移到Lightrun服务器上,这可能会产生成本。这意味着,虽然快照对诊断问题非常有用,但我们要确保它们不会在需要的时间内停留。Lightrun为我们解决了这一问题,它自动使快照过期,从而使它们只对我们的应用程序产生确切的影响,而不是更多。
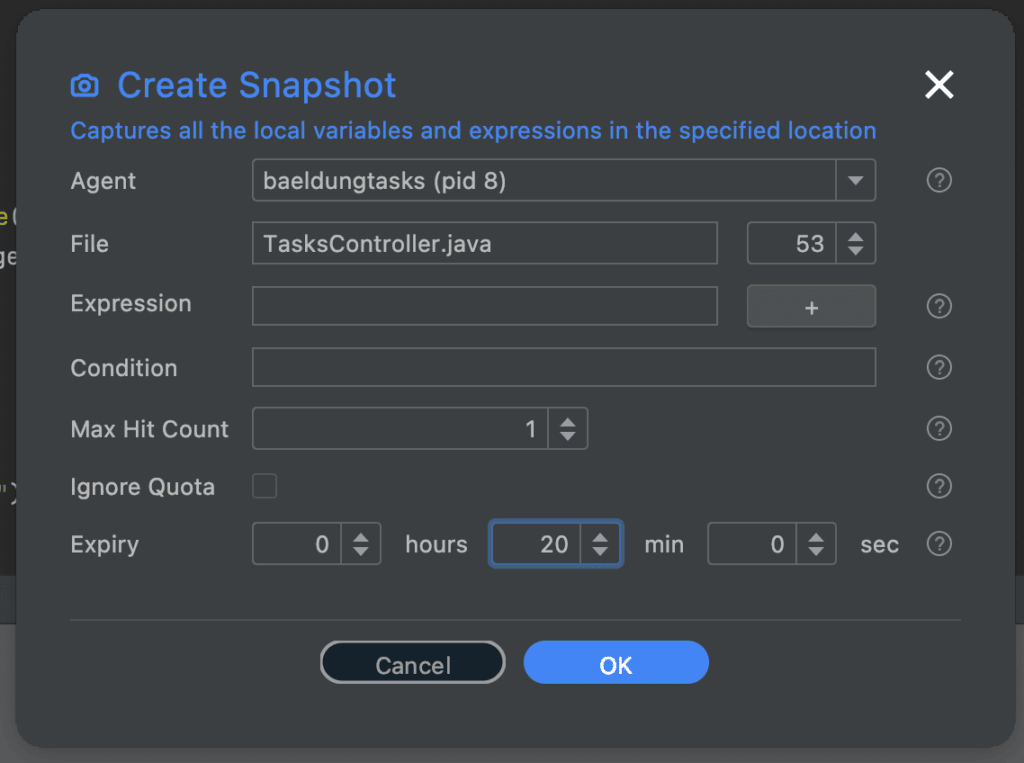
By default, snapshots will automatically be disabled after 1 hour. We can set this to an incredibly short period of time if we want to do some focused testing ourselves with minimal impact. Alternatively, we can set this to a very long period of time, for example, to capture any occurrences of a particular issue happening overnight, over a weekend, or even longer.
默认情况下,快照将在1小时后自动禁用。如果我们想在影响最小的情况下自己做一些重点测试,我们可以把这个时间段设置得非常短。另外,我们也可以将其设置为很长的时间段,例如,捕捉一夜之间发生的任何特定问题,在一个周末,甚至更长时间。
We can adjust the duration for which the snapshot will be active from the “Advanced” section of the Create Snapshot dialog. This gives us an extra option for the Expiry time, which lets us specify, in hours, minutes, and seconds, how long the snapshot will be active for:
我们可以在创建快照对话框的 “高级 “部分调整快照的活动时间。这为我们提供了一个额外的到期时间选项,让我们以小时、分钟和秒为单位,指定快照将被激活的时间。
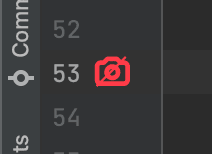
After this time the snapshot will remain present so that the recorded snapshots are still available. However, it will stop recording anything – even if we haven’t yet reached the maximum hit count. If we don’t change this then the default will be 1 hour. When this time passes, the camera icon for our snapshot turns red to indicate that it is no longer active:
在这个时间之后,快照将继续存在,以便记录的快照仍然可用。然而,它将停止记录任何东西–即使我们还没有达到最大点击数。如果我们不改变这一点,那么默认将是1小时。当这个时间过去后,我们的快照的相机图标会变成红色,表示它不再活动。
Note that the snapshot remains in our system because otherwise, the recorded data wouldn’t be available. However, it won’t record any more data unless it is re-enabled.
请注意,快照仍然保留在我们的系统中,因为否则,记录的数据就无法使用。然而,除非重新启用,否则它不会再记录任何数据。
3. Logs
3.日志
Another facility that Lightrun offers are the ability to add logging statements into our application dynamically without needing to change or restart anything.
Lightrun提供的另一项设施是将记录语句动态地添加到我们的应用程序中,而不需要改变或重新启动任何东西。
Logs are similar to Snapshots in how they are configured but are different in their purposes. Snapshots work by recording the exact state of the thread at the time they are triggered. Logs instead will write out to the log stream the information required.
日志在配置方式上与快照相似,但在目的上却不同。快照的作用是记录线程在被触发时的确切状态。而日志将向日志流写出所需的信息。
This means that many log messages – either built into the application or dynamically added by Lightrun – will mix together in the log stream and give a bigger picture of what’s happening. We will get to see both the log messages from our application and any logs added by Lightrun combined into the same stream, giving us a full picture of exactly what is happening.
这意味着许多日志信息–无论是内置在应用程序中的还是由Lightrun动态添加的–将在日志流中混合在一起,并提供一个更大的正在发生的图片。我们将看到来自我们的应用程序的日志信息和Lightrun添加的任何日志信息混合在同一个流中,让我们全面了解到底发生了什么。
3.1. Adding Dynamic Logs
3.1.添加动态日志
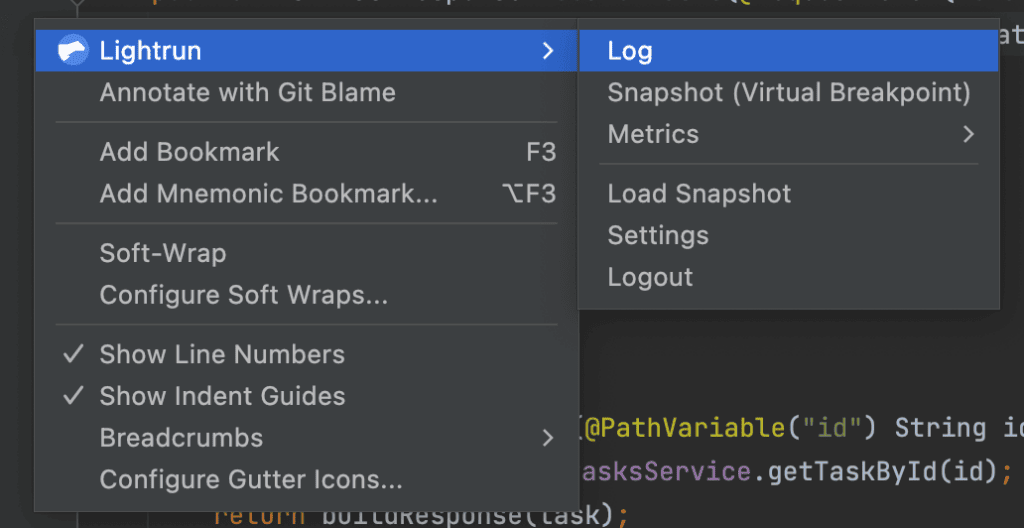
Adding dynamic logs with Lightrun is done in a very similar way to adding Snapshots. We right-click on the line we want to add the log statement before and select “Lightrun > Log” from the menu:
用Lightrun添加动态日志的方式与添加快照非常相似。我们右击我们想要添加日志语句的行,从菜单中选择 “Lightrun > Log”。
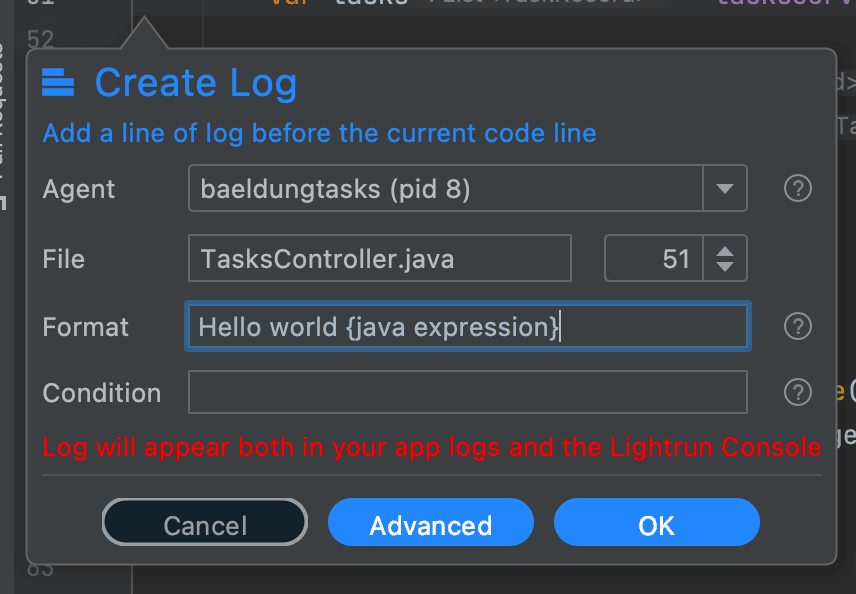
This then gives us a dialog to configure the dynamic log statement with, and then add it to our running application:
这就给了我们一个对话框来配置动态日志语句,然后把它添加到我们正在运行的应用程序中。
This gives us the ability to specify the log message that will be output – which can include dynamic expressions as part of the message. We can also specify a condition required to trigger the log message, in exactly the same way as snapshot conditions work.
这使我们能够指定将被输出的日志信息–它可以包括作为信息一部分的动态表达式。我们还可以指定触发日志信息所需的条件,与快照条件的工作方式完全相同。
By default, these log messages will expire after 1 hour, but this can also be changed the same as for snapshots by clicking on the “Advanced” button.
默认情况下,这些日志信息将在1小时后过期,但这也可以通过点击 “高级 “按钮来改变,与快照相同。
Log messages also have a logging level, which defaults to INFO but we can change them to DEBUG, WARN, or ERROR as desired.
日志信息也有一个日志级别,默认为INFO,但我们可以根据需要将其改为DEBUG、WARN或ERROR。
Once we’ve added a log statement, the editor will indicate this in the code view to show where the log statement is and what it is doing:
一旦我们添加了一个日志语句,编辑器就会在代码视图中显示这一点,以显示日志语句的位置和它正在做什么。
3.2. Viewing Logs
3.2.查看日志
By default, our dynamic log messages are written out using Java Util Logging. In this case, we are able to see them interleaved with any other log messages that the application produces, which can give more information:
默认情况下,我们的动态日志信息是使用Java Util Logging写出来的。在这种情况下,我们能够看到它们与应用程序产生的任何其他日志消息交错在一起,这可以提供更多信息。
It is also possible to have the log messages sent to our editor to view locally. These can be seen in the Lightrun console similar to how we see Snapshots. This can be very useful if we want to add logging to a system without adding extra noise to the output log files, especially if those logs are being consumed by other team members or other systems:
也可以将日志信息发送到我们的编辑器中进行本地查看。这些可以在Lightrun控制台中看到,类似于我们看到快照的方式。如果我们想在不给输出的日志文件添加额外噪音的情况下给系统添加日志,这可能非常有用,特别是当这些日志被其他团队成员或其他系统消耗时。
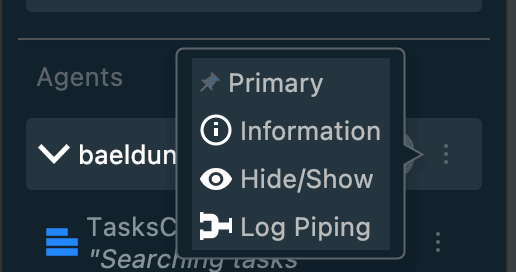
We can change where the log messages output goes by opening the agent menu in the sidebar and selecting Log Piping:
我们可以通过打开侧边栏的代理菜单并选择日志管道来改变日志信息输出的位置。
From here we can select between App – which means writing to the configured Java Util Logging setup of the application, Plugin – which means writing to the Lightrun Plugin active in our editor, or Both. Note that this is done for an entire Lightrun agent and not for individual log messages.
从这里我们可以选择App–这意味着写到应用程序的配置的Java Util Logging设置,Plugin–这意味着写到我们编辑器中激活的Lightrun Plugin,或者两者都写。注意,这是为整个Lightrun代理做的,而不是为单个日志信息做的。
Because of the way the Lightrun agent works, the Java Util Logging config is not the standard one from the application. Instead, there are some Lightrun agent flags that are needed to configure the destination and output format of the Lightrun dynamic logger when it’s writing to Java Util Logging.
由于Lightrun代理的工作方式,Java Util Logging的配置不是来自应用程序的标准配置。相反,有一些Lightrun代理标志需要配置Lightrun动态记录器在写入Java Util Logging时的目的地和输出格式。
3.3. Logging Expressions
3.3.记录表达式
Logging simple strings is already useful. However, logging values from the application is significantly more useful. In the same way that our snapshots can include custom expressions, we’re able to do this for logs.
记录简单的字符串已经很有用了。然而,从应用程序中记录数值要有用得多。就像我们的快照可以包括自定义表达式一样,我们也能够为日志做这件事。
When we do this with logs, we’re adding the expression directly into the log message. This is done by wrapping the expression in curly braces:
当我们在日志中这样做时,我们将表达式直接添加到日志信息中。这是通过将表达式包裹在大括号中完成的。
Searching tasks: status={status}, createdBy={createdBy}When we do this, any of these expressions will be automatically expanded when the log statement is generated:
当我们这样做时,这些表达式中的任何一个都会在生成日志语句时被自动展开。
These expressions can be anything that can be determined at the point the log statement is generated, in the exact same way as for snapshots.
这些表达式可以是在生成日志语句时可以确定的任何东西,与快照的方式完全相同。
These expressions can sometimes take up a lot of CPU time to calculate. If this happens, Lightrun may automatically pause a particular log so that they do not interfere with the running of the application. As such, it is recommended to keep logging expressions as simple as possible.
这些表达式有时会占用大量的CPU时间来进行计算。如果发生这种情况,Lightrun可能会自动暂停某个特定的日志,这样它们就不会干扰到应用程序的运行。因此,建议尽可能保持日志表达式的简单。
4. Metrics
4.度量衡
The final action that we can perform with Lightrun is to record some metrics about our application. This gives us the ability to see usage details of our application – for example, how often certain things happen or how long they take.
我们可以通过Lightrun执行的最后一项操作是记录一些关于我们应用程序的指标。这使我们能够看到我们应用程序的使用细节 – 例如,某些事情发生的频率或花费的时间。
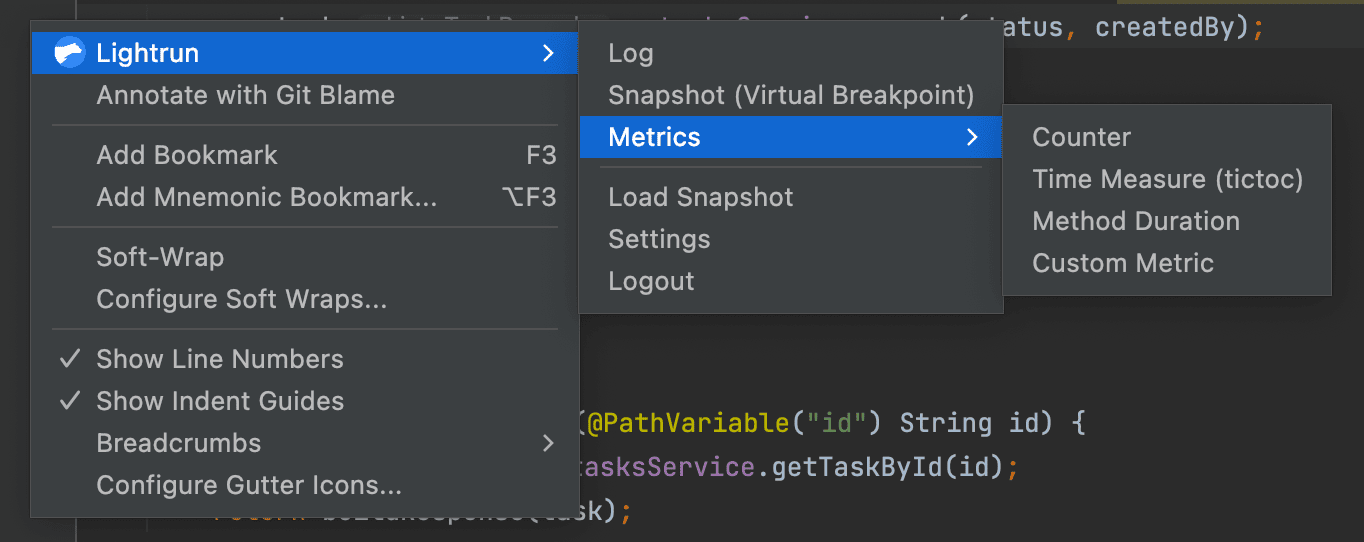
In the same way as with Snapshots and Logs, Metrics are added by right-clicking on the appropriate line of code and selecting “Lightrun > Metrics”:
与快照和日志的方式相同,指标的添加是通过右击适当的代码行并选择 “Lightrun > Metrics”。
Immediately we can see that this is slightly different – we have different types of metrics that we can add:
我们立即可以看到,这略有不同–我们有不同类型的指标可以添加。
- Counter – This records a simple count of the number of times a line of code was executed.
- Time Measure – This records the time it takes to get between two lines of code.
- Method Duration – This records the time it takes between entering and exiting a method.
- Custom Metric – This uses a custom expression to generate the metric, based on values available in the code.
In each case, we get the standard Lightrun dialog for creating our metric. This lets us configure the metric, including adding a name for the metric, conditions under which it is triggered, and an expiry time after which it stops working – in the exact same way that we can for Snapshots and Logs.
在每种情况下,我们都会得到用于创建指标的标准Lightrun对话框。这让我们可以配置指标,包括为指标添加一个名称,在什么条件下触发,以及过期时间,过期后停止工作–与我们对快照和日志的配置方式完全相同。
These metrics are output to the logging process by default, but can also be integrated into StatsD, Prometheus, and other tools if desired.
这些指标默认输出到日志程序,但如果需要,也可以集成到StatsD、Prometheus和其他工具中。
4.1. Counters
4.1.计数器
Counters are a simple measure of the number of times some code was executed. Every time our line of code is reached, the counter increments by 1, and we can then see how often this has happened.
计数器是对某些代码执行次数的简单衡量。每当我们的代码行到达时,计数器就会递增1,然后我们可以看到这种情况发生的频率。
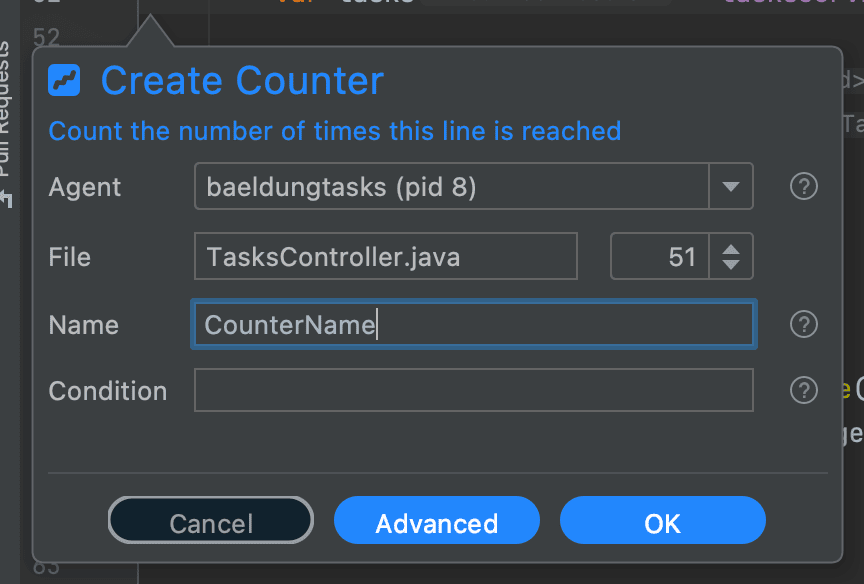
Adding a counter is done by selecting Counter from the Lightrun menu and then filling in the dialog:
添加一个计数器是通过从Lightrun菜单中选择计数器,然后填写对话框来完成的。
Most of this is fairly standard. The only bit that is unusual is the “Name” field – we need to give every counter a unique name so that we can track them all.
这其中的大部分是相当标准的。唯一不寻常的是 “名称 “字段–我们需要给每个计数器一个独特的名称,以便我们能够跟踪它们。
In particular, one powerful feature here is that we can set up counters – as with all of the metrics – that have conditions attached to them. This gives us the ability to count the number of times a certain line of code is reached only when other conditions are met, for example only for a certain user or affecting certain records.
特别是,这里的一个强大的功能是,我们可以设置计数器–和所有的指标一样–有条件的附加在上面。这使我们有能力计算某一行代码只有在满足其他条件的情况下才会达到的次数,例如,只对某个用户或影响某些记录。
Adding a counter doesn’t do anything immediately. However, once it is triggered for the first time, it will start reporting out the metric values in a similar way to how logs are output – to the logging output based on the piping setting.
添加一个计数器并不会立即做任何事情。然而,一旦它第一次被触发,它将开始以类似于日志输出的方式报告出度量值 – 基于管道设置的日志输出。
Our editor shows the values from the metric every 10 seconds:
我们的编辑器每10秒显示一次指标值。
Whereas the log output shows the metric every second:
而日志输出显示的是每秒钟的度量。
This output is controlled by the exact same setting as log output and will interleave our metrics with our logs to give a better picture of what is happening. This lets us track over time how the metric has changed, to see the rate at which the code was triggered.
这个输出是由与日志输出完全相同的设置控制的,并将我们的指标与我们的日志交错在一起,以便更好地了解正在发生的一切。这可以让我们跟踪一段时间内指标的变化情况,看看代码被触发的速度。
4.2. Time Duration
4.2.时间长度
Where Counters are used to measure the number of times a line of code was executed, a Time Duration is used to measure how long the code is running. These are also called “TicToc” metrics – Tic to start recording and Toc to stop recording, similar to the noise of a clock.
计数器用于测量一行代码的执行次数,而时间长度则用于测量代码的运行时间。这些也被称为 “TicToc “指标–Tic表示开始记录,Toc表示停止记录,类似于时钟的噪音。
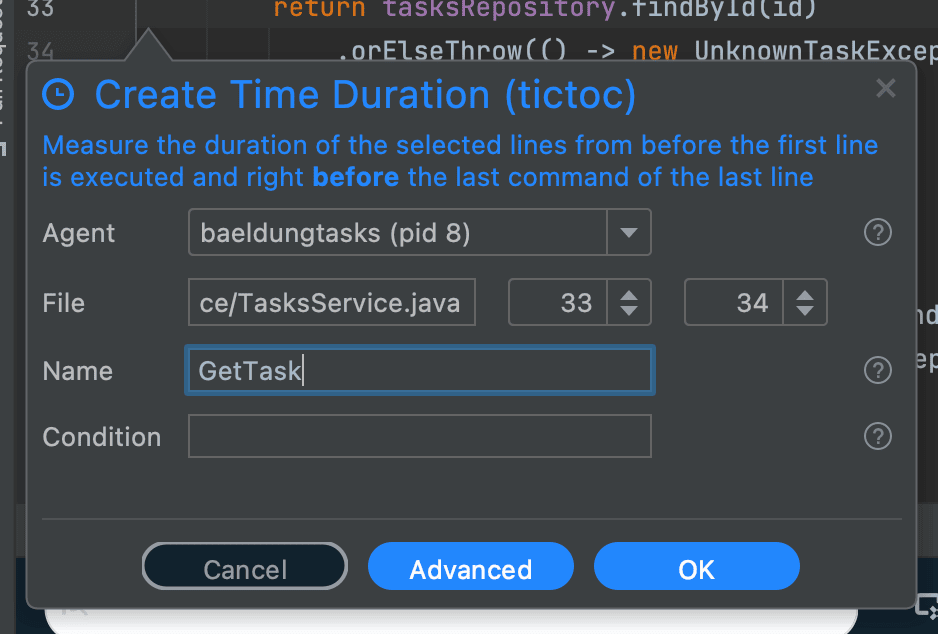
When creating a time duration, we need to configure exactly which piece of code we’re measuring. This is done by specifying the lines to start and stop recording on – either by selecting a block of code before opening the dialog or by entering the line numbers within the dialog:
当创建一个时间长度时,我们需要准确地配置我们正在测量的那段代码。这是通过指定开始和停止记录的行来实现的–在打开对话框之前选择一个代码块或在对话框中输入行号。
Other than this, creating a time duration is the same as creating a counter.
除此以外,创建一个时间段与创建一个计数器是一样的。
Once created, these metrics will start outputting immediately, rather than waiting for the first time they are triggered. These outputs are to both the plugin and application standard output, exactly the same as for counters, and will show us how often the section of code was run and the fastest, slowest, and mean times that the code has taken to run:
一旦创建,这些指标将立即开始输出,而不是等待它们第一次被触发。这些输出到插件和应用程序的标准输出,与计数器完全相同,并将向我们显示该部分代码的运行频率以及代码运行的最快、最慢和平均时间。
4.3. Method Duration
4.3.方法期限
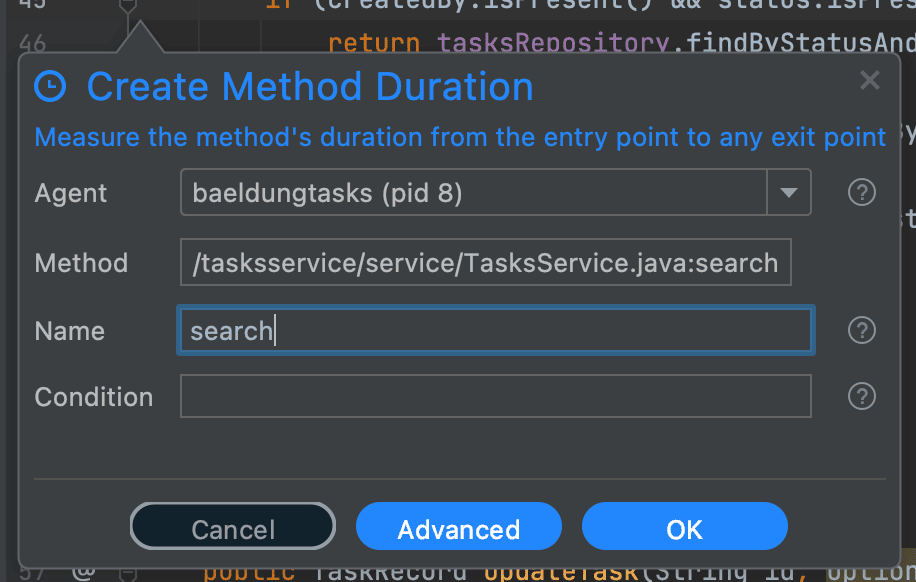
Method Duration metrics are essentially the same as Time Duration, but instead of specifying start and end lines we specify the full method:
方法持续时间指标本质上与时间持续时间相同,但我们不指定开始和结束线,而是指定完整的方法。
Once added, this functions exactly the same as time duration metrics covering the whole method body. The start time is considered to be when the method is entered, and the end time is when it is left, regardless of whether it’s by a return or an exception:
一旦加入,其功能与涵盖整个方法体的时间长度指标完全相同。开始时间被认为是进入该方法的时间,结束时间是离开该方法的时间,不管是通过返回还是异常。
We can see from the output here that these are actually “TicToc Log” entries too, only Lightrun has automatically determined the start and stop points for us based on the method itself and not based on lines of code.
我们可以从这里的输出看到,这些实际上也是 “TicToc日志 “条目,只是Lightrun根据方法本身,而不是根据代码行,自动为我们确定了开始和停止点。
4.4. Custom Metric
4.4.自定义公制
Our final metric is simply a custom metric. This lets us aggregate numbers that are present in our code somehow, whatever those numbers are. For example, we might want to count the number of records returned in some search results.
我们的最后一个指标是一个简单的自定义指标。这可以让我们以某种方式汇总存在于我们代码中的数字,无论这些数字是什么。例如,我们可能想计算在一些搜索结果中返回的记录数。
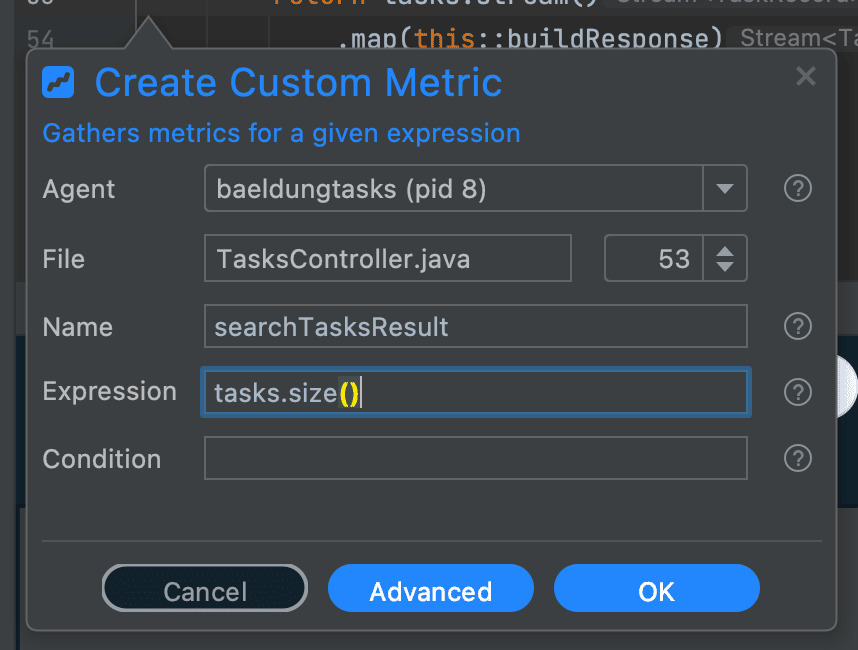
When creating this type of metric, we’re required to specify an expression. This expression returns the number that our metric will aggregate, and like elsewhere it can be any expression that can be calculated at this point in our code:
在创建这种类型的度量时,我们需要指定一个表达式。这个表达式会返回我们的度量衡将聚合的数字,和其他地方一样,它可以是我们代码中这一点上可以计算的任何表达式。
When these metrics output, it shows us the number of times it was triggered and the maximum, minimum, and mean values for our expression:
当这些指标输出时,它向我们显示了它被触发的次数以及我们表达式的最大、最小和平均值。
5. Summary
5.总结
Here we have covered in detail the main ways that Lightrun can give us more insight into our applications and better understand how they are working.
在这里,我们已经详细介绍了Lightrun可以让我们更深入地了解我们的应用程序并更好地理解它们的工作方式的主要方法。
Why not use it in your next application, to better understand what is going on or even to help diagnose any issues that might be going on?
为什么不在你的下一个应用中使用它,以更好地了解正在发生的事情,甚至帮助诊断可能发生的任何问题?
